Original research · 2026
The State of SaaS Pricing 2026
We analyzed the published pricing of 800 software tools across 42 categories, each verified from the vendor’s own pricing page and set against the best 2026 industry benchmarks. Here is what software actually costs, how the shift to usage and AI pricing is really playing out, and what it means if you’re pricing your own product. Every number is free to cite; the full dataset is downloadable.
1. The shift to usage & hybrid pricing is real — but quieter than the headlines
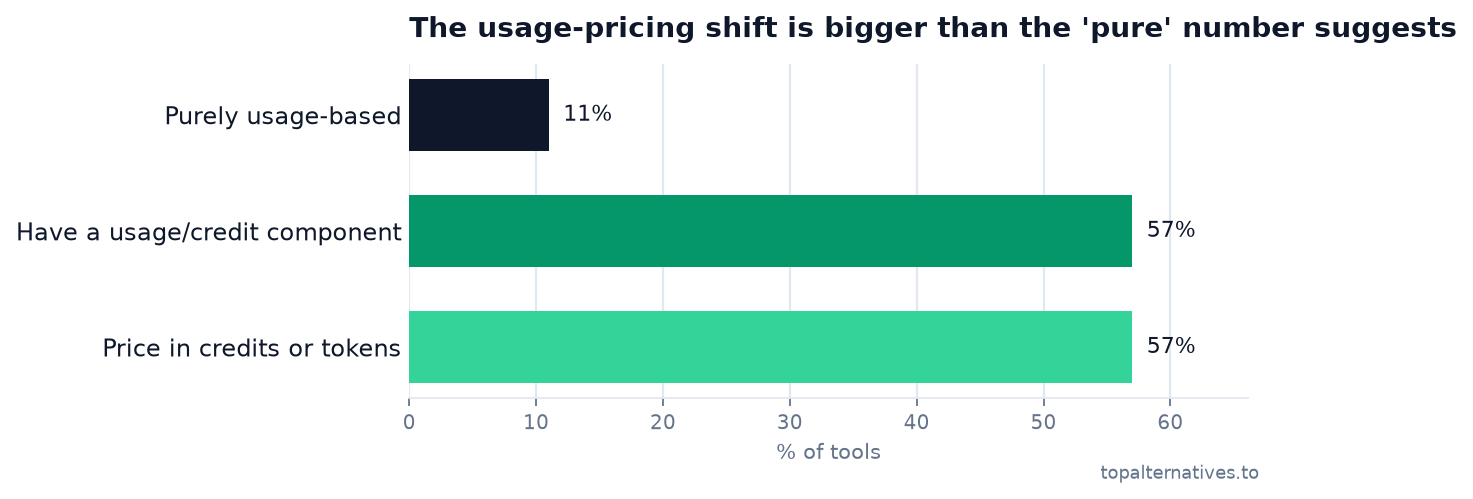
Pure per-seat pricing is fading, but the “everything is usage-based now” story is overstated. In our data, only 11% of tools are purely usage-based — yet 57% (455 tools) now carry some usage or credit component on top of a subscription, and 455 price at least partly in credits or tokens. The action isn’t pure usage; it’s hybrid.
That tracks the wider market. Kyle Poyar’s 2026 survey finds hybrid is now the single most common model at ~40% of companies, Bessemer reports 51% of public SaaS have a usage-based component, and OpenView’s older baseline of 39% charging on usage shows how far it has come. Our 57% (across companies of all sizes, not just public ones) sits right where you’d expect.
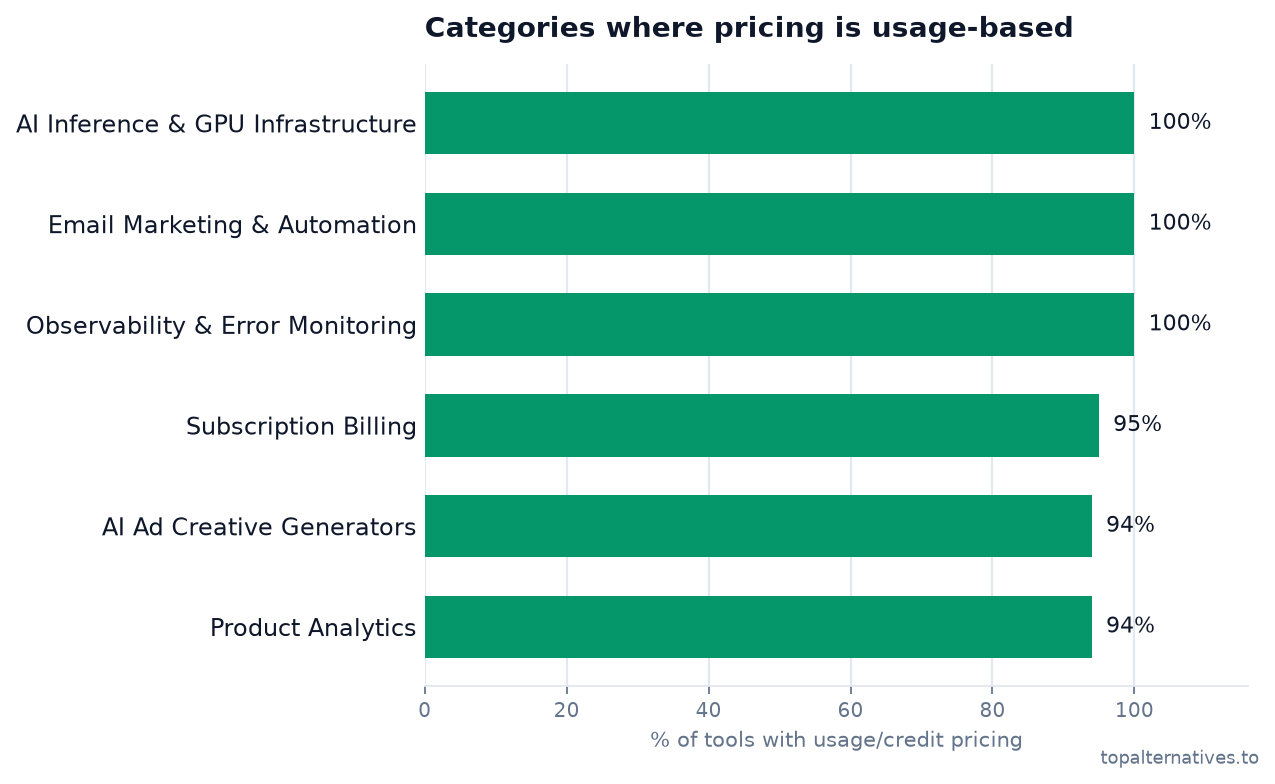
Where has usage pricing already won? Infrastructure, data, and AI:
2. AI, tokens & credits: the real “AI tax” is in the meter, not the sticker
The most counterintuitive finding: AI tools aren’t more expensive to start — if anything they’re cheaper. Their median entry price is $20, below the $25 median for everything else (an AI “tax” of just 0.8×). The premium isn’t in the sticker price; it’s in how they charge: 69% of AI tools meter by usage or credits, versus 57% of software overall. You start cheap, then the bill scales with what you consume — the AI tax is in the meter, not the menu.
That’s the defining pricing story of 2026. Credit and token models are the fastest-growing pricing trend anywhere in software — up 126% year over year (35 → 79 companies in the PricingSaaS 500 Index), with ~29% of software firms already selling AI credits. The reason is margin math: AI-native products run 50–60% gross margins versus 80–90% for traditional SaaS because every query has a real per-inference cost. So pricing is converging on three metrics — consumption (per token/call), workflow (per task), and outcome (per result). The canonical example: Intercom’s Fin charges $0.99 per resolution, not per seat.
And there’s a gap worth noticing: even as everyone ships AI, 67% of SaaS companies with AI features don’t charge extra for them yet. If you have AI and you’re not metering it, you’re in the majority — and probably leaving money on the table.
3. What software actually costs
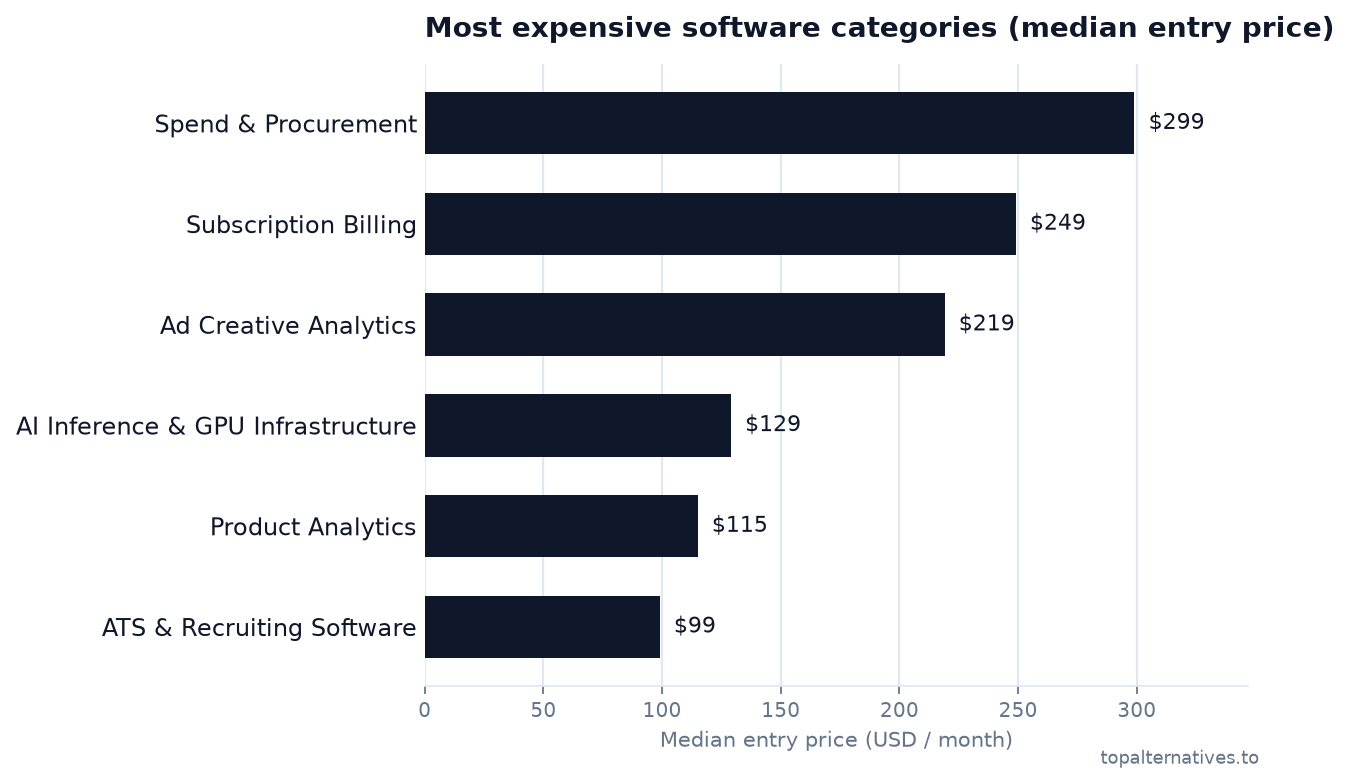
The median tool starts at $25 per seat, per month, but the average is $99 — a 4× gap, because a handful of enterprise tools drag the mean up. When a vendor cites “average market price,” the median is the honest number. By category, the priciest entry points:
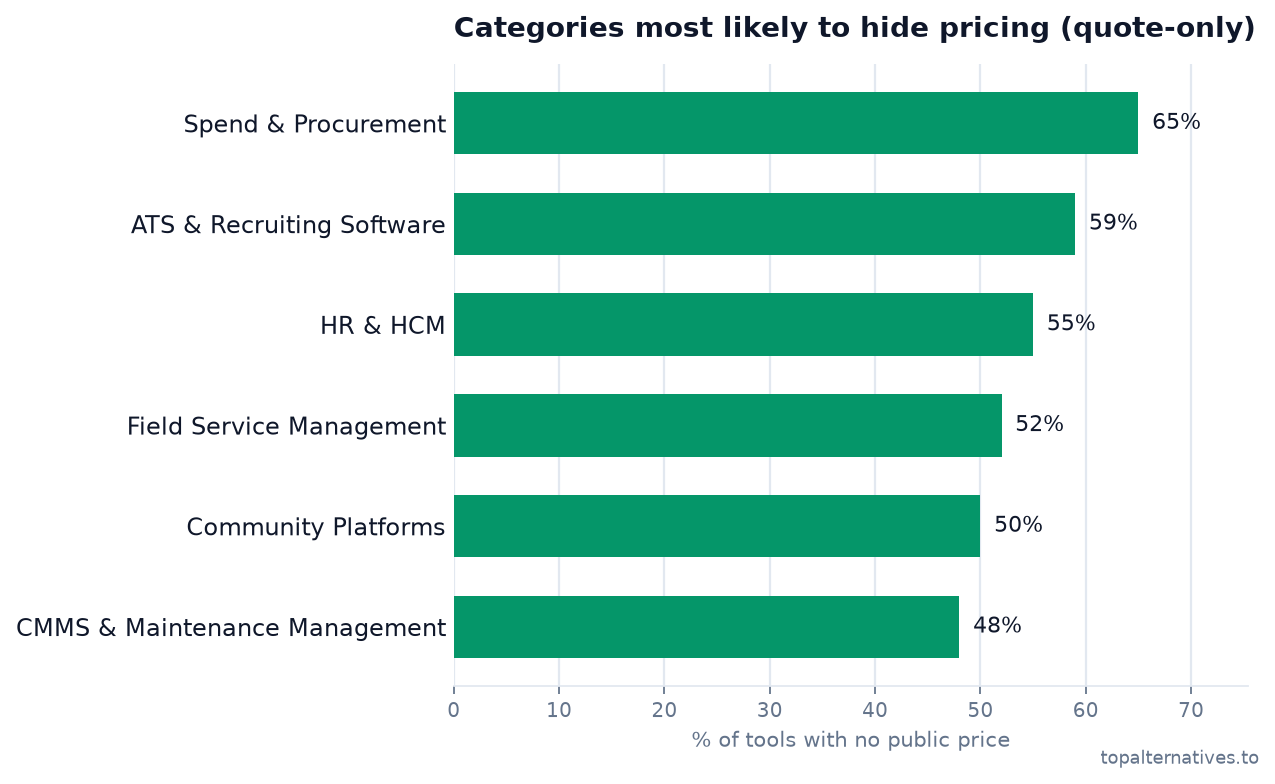
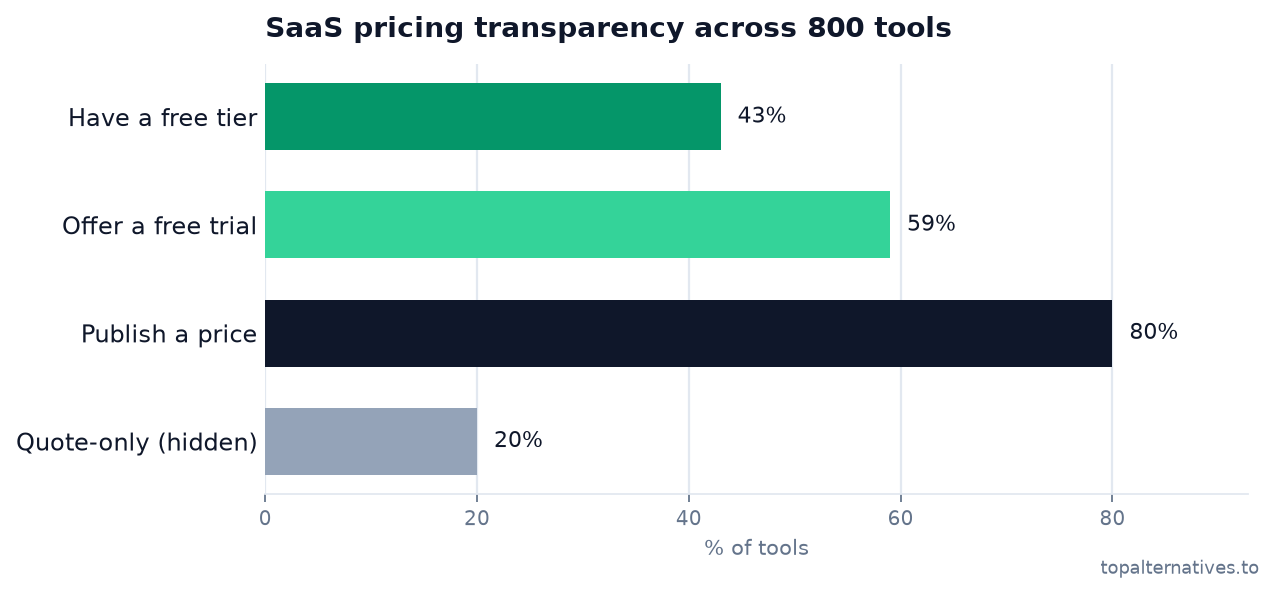
And 20% of tools are quote-only — no price anywhere, just “contact sales.” It’s wildly uneven: in Spend & Procurement, 65% of vendors hide their pricing.
4. How tools stack tiers — the ladder, the names, and the “enterprise tax”
We read every published tier for 234 tools that lay out a full plan grid, and the shape is remarkably consistent. The typical SaaS page has 4 tiers (median 4), and 80% ship between two and four. Two is too few to anchor and steer; five is a wall of columns nobody reads. Four is the sweet spot: a cheap starter, a “most popular” middle, a power tier, and a quote-only enterprise column.
The price ladder
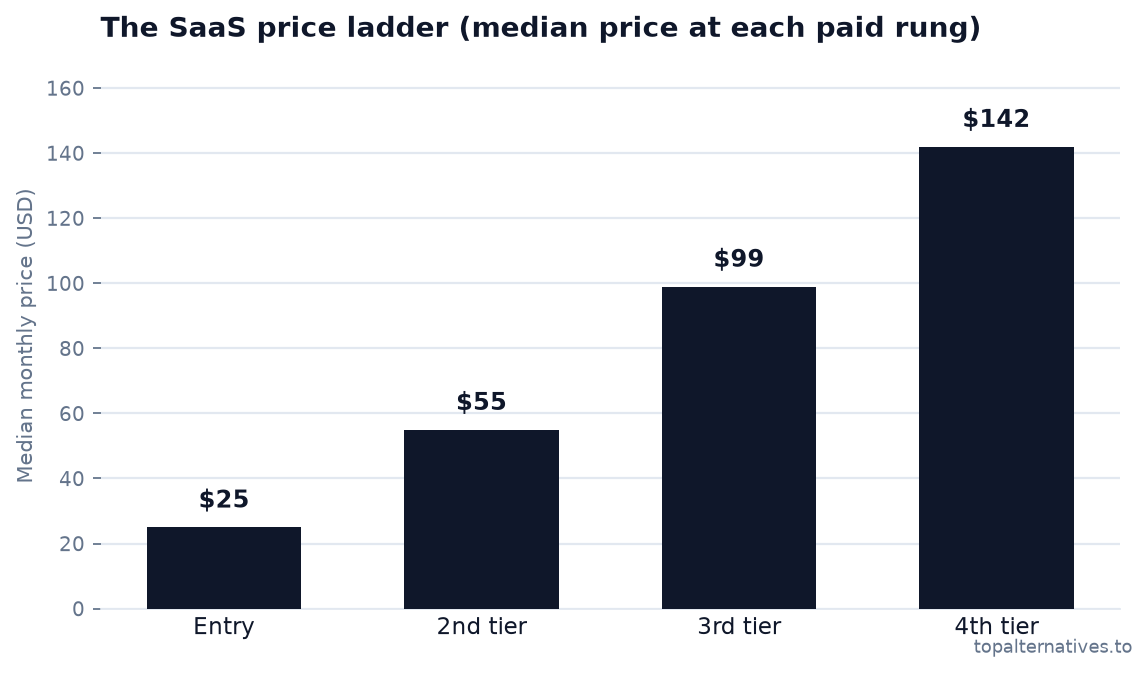
Line those rungs up and a clean staircase appears. The median entry tier is $25, the second rung $55, the third $99, and the fourth $142. Each step is roughly a 2×, then 1.8×, then 1.4× jump: the first upsell hurts the most, and each rung after that adds less in percentage terms while adding more in dollars. Above the fourth rung sits the enterprise tier, which usually drops the number entirely.
The tier dictionary
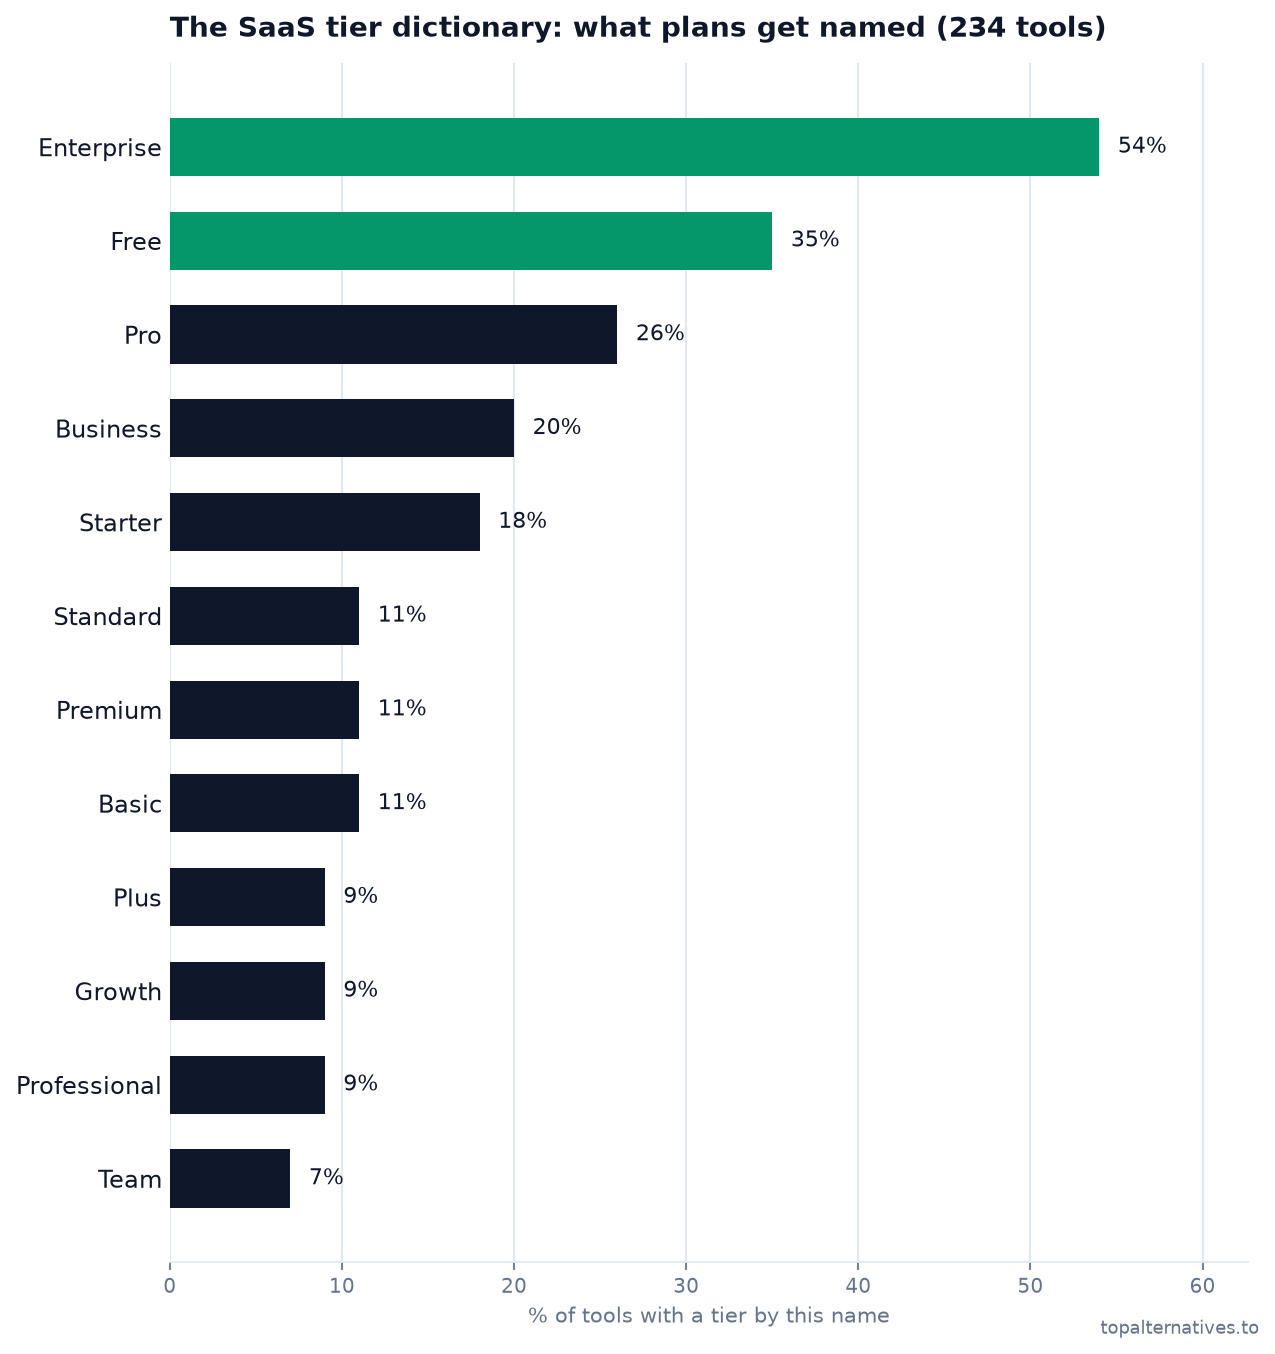
SaaS also speaks a shared dialect. The single most common tier name in all of software is “Enterprise” (54% of tools have one), followed by “Free” (35%), “Pro” (26%), and “Business” (20%). The positions are just as predictable: the entry tier is almost always a Starter, Pro, Basic; the workhorse middle is Pro or Professional; and the top of the public grid is Enterprise nearly every time. If you are naming your own plans, this is the map buyers already have in their heads.
The enterprise tax
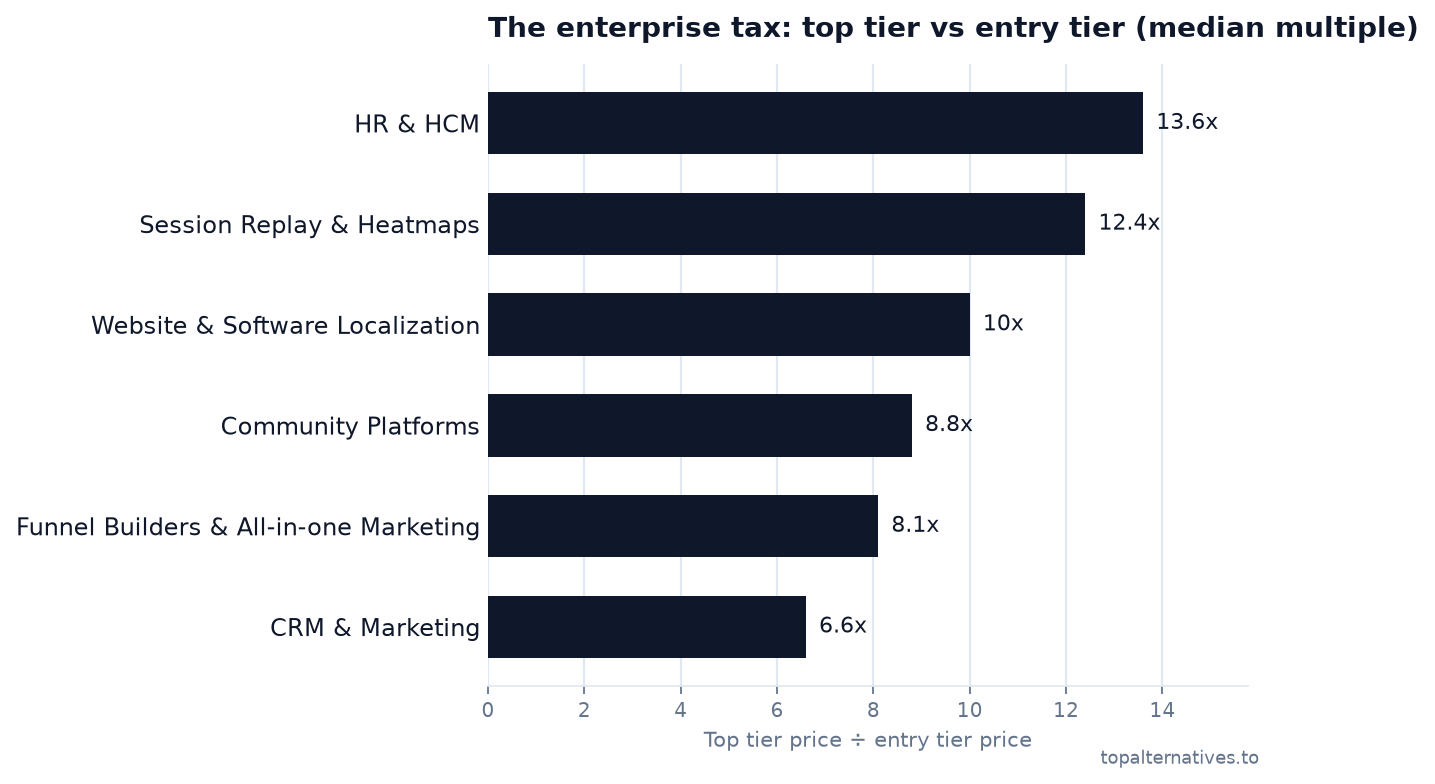
The jump from the entry tier to the top published tier is the “enterprise tax.” Across the full set the second tier is a median 2.06× the entry and the top published tier is a median 3.4×. In some categories it is brutal:
5. Behind the “contact sales” curtain
We checked every tool for a hidden top tier — the “Enterprise” column with a Contact sales button instead of a price. 70% of the 850 tools we could analyze have one (68% of everyone who publishes tiers at all). It is now the default endgame of a SaaS pricing page, not the exception.
So what are you actually buying when you “contact sales”? We read the feature lists. It is far less about product and far more about trust, control, and a human. The most commonly gated item is dedicated support or a customer success manager (65%), followed by higher or unlimited usage limits (52%). Then comes the security-and-compliance bundle that mid-market and enterprise buyers can’t sign without: SSO (44%), advanced security and compliance (43%), role-based access, SAML, audit logs, SCIM provisioning, and data residency all cluster here.
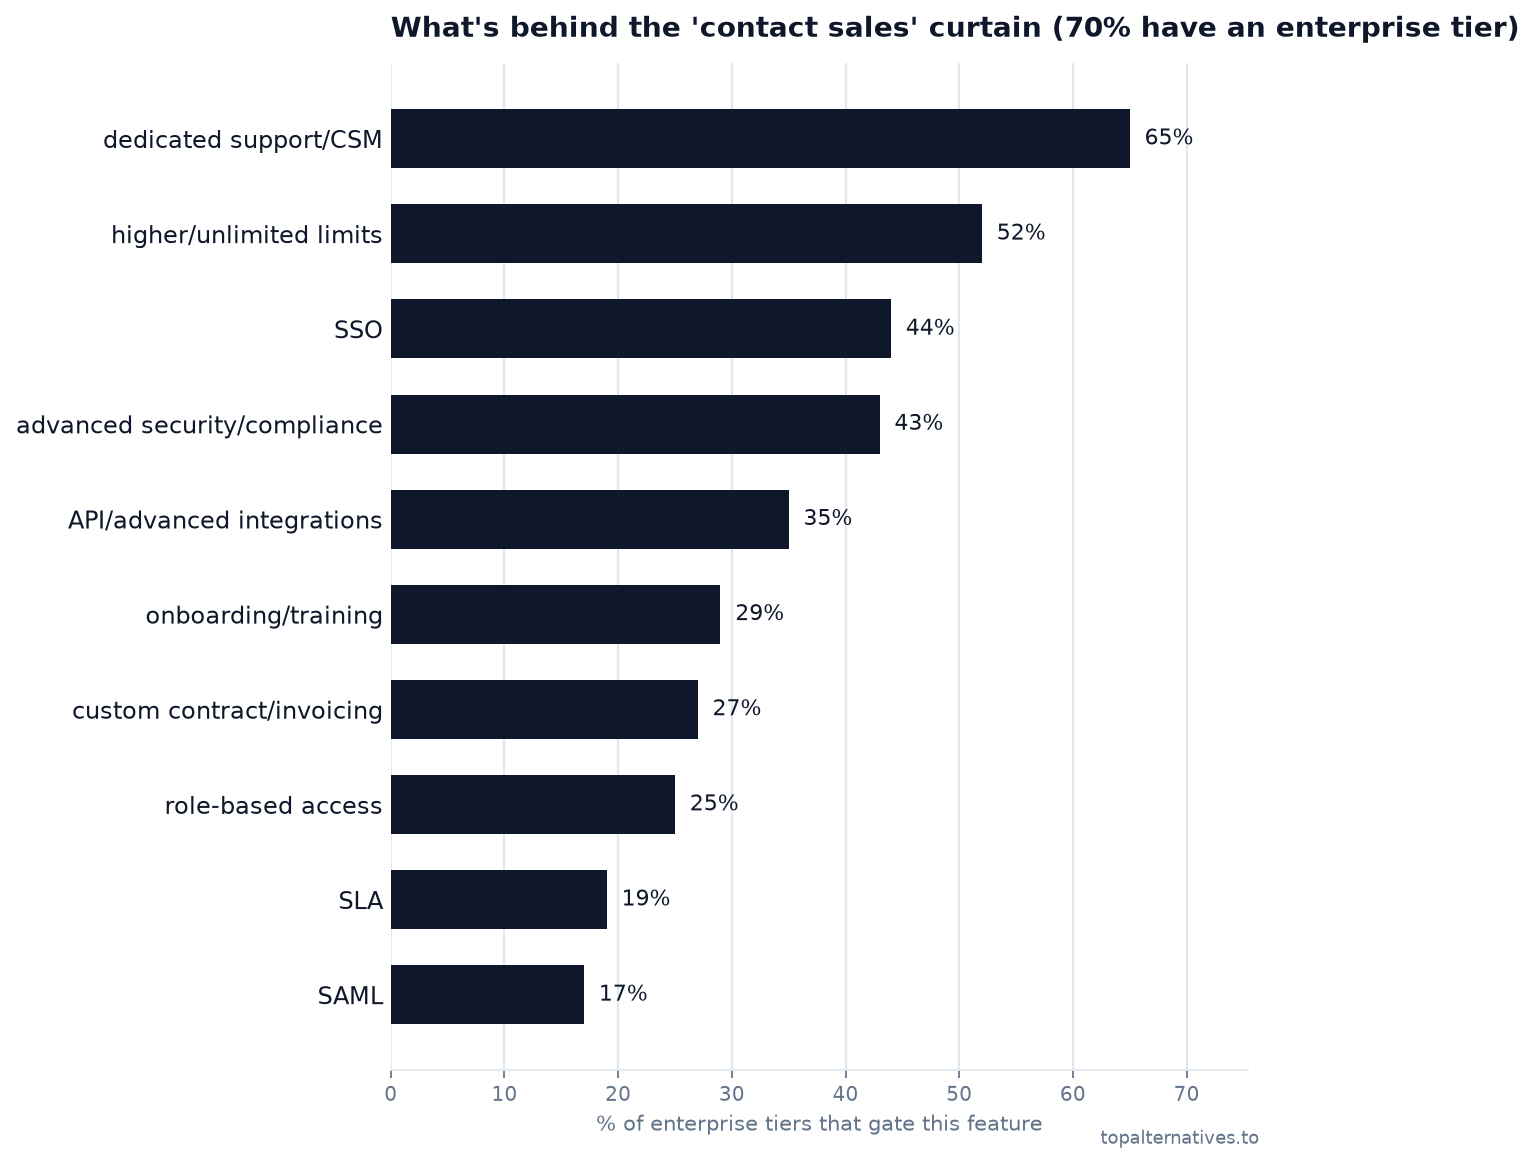
The pattern: the enterprise tier is where SSO goes to hide. Nearly half of enterprise plans put single sign-on behind a sales call — the practice the industry nicknamed the “SSO tax.” If you’re a founder, the takeaway is blunt: buyers expect security basics to cost extra, but gating SSO too aggressively is the fastest way to lose a security review. Price the human and the limits; be careful pricing the padlock.
6. Charm pricing: the psychology of the last digit
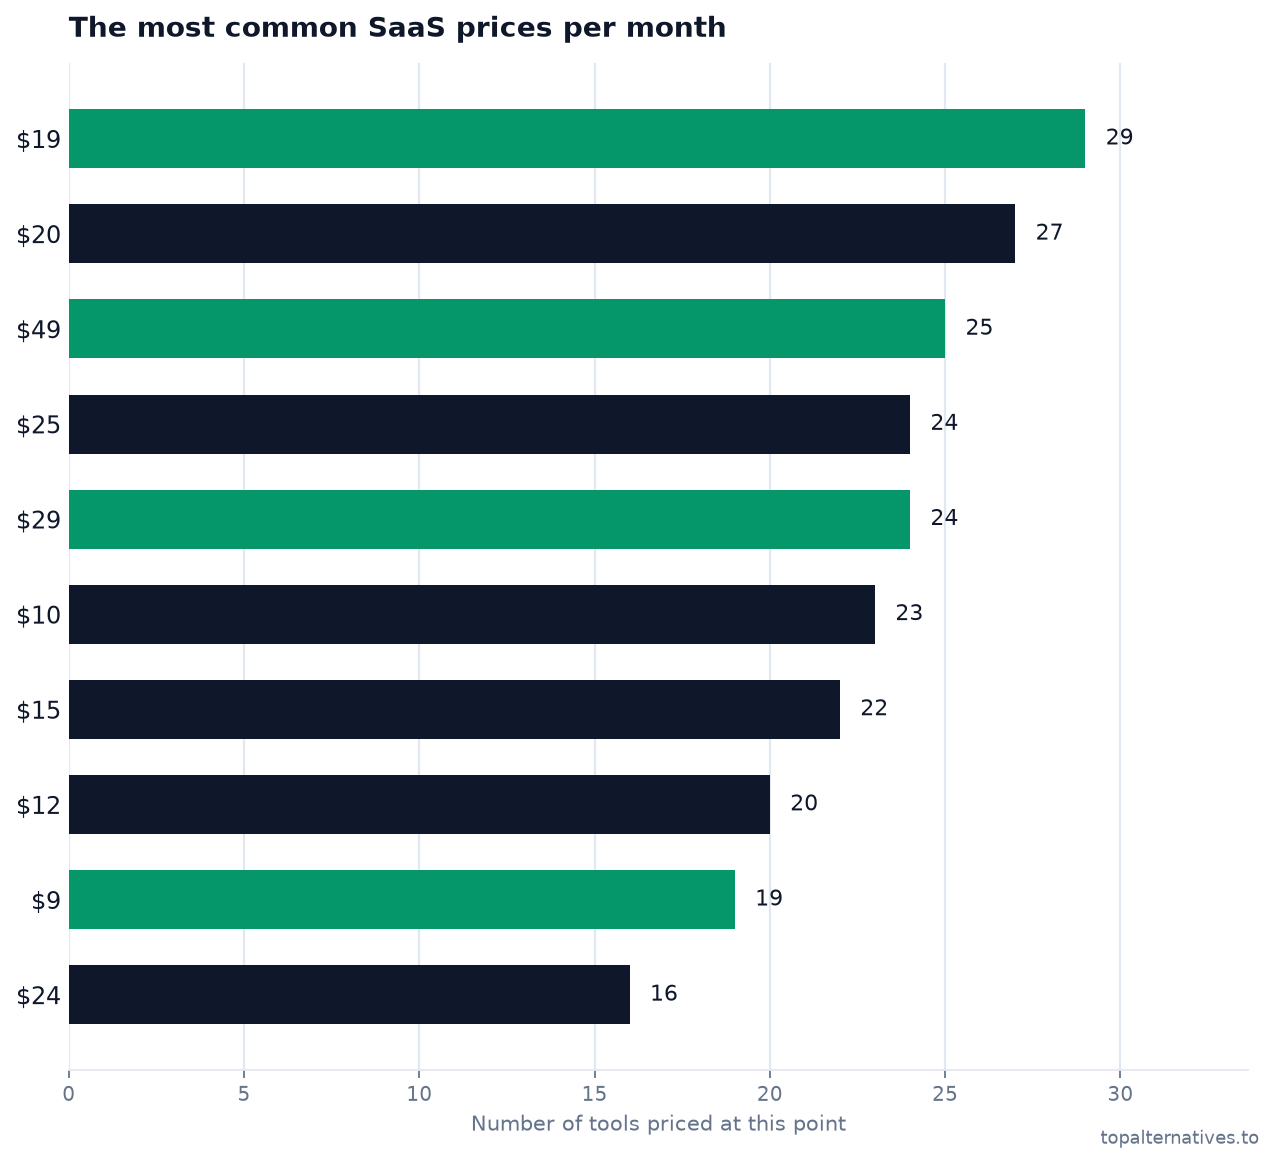
39% of all published prices end in a 9 ($19, $49, $99) — charm pricing is the dominant convention. The single most common prices in all of SaaS are $19 and $20.
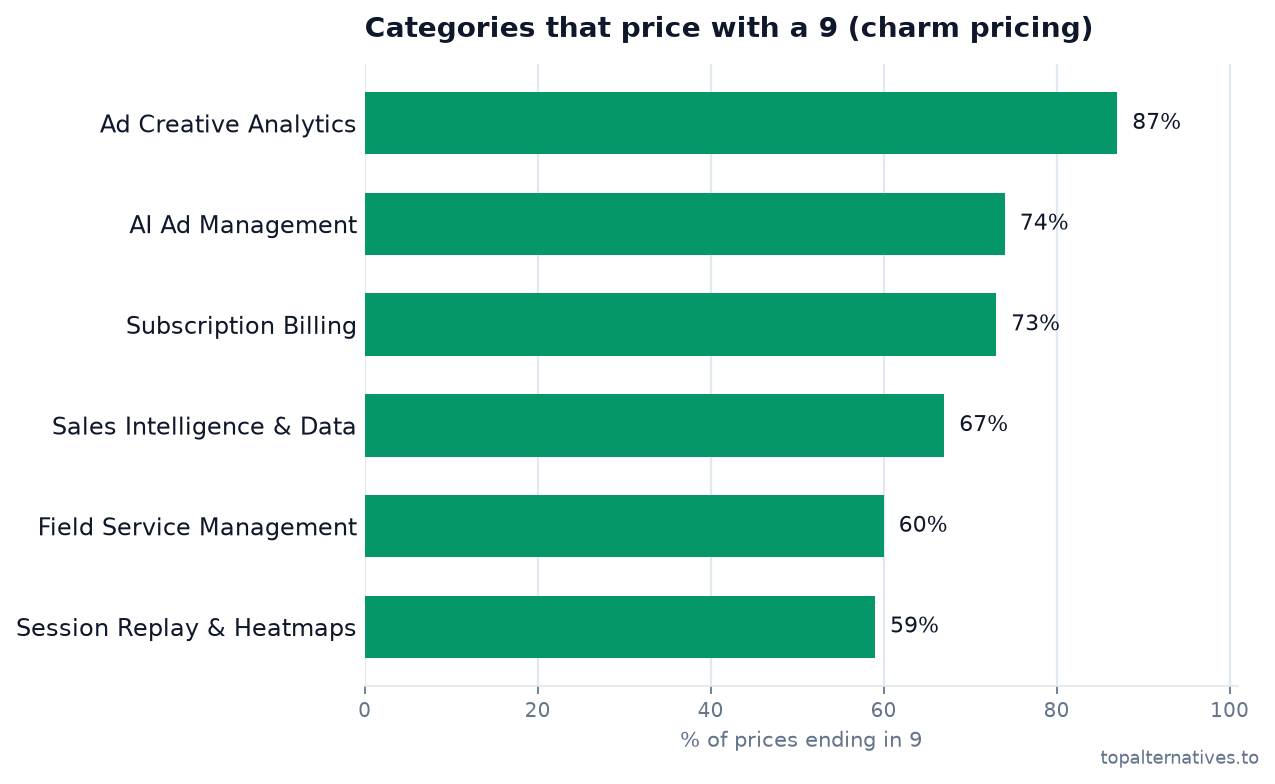
It splits sharply by industry: AI and marketing tools price with 9s (Ad Creative Analytics end in 9 87% of the time), while traditional categories reach for round numbers (Digital Asset Management end in 0 53% of the time). And round numbers get more common the pricier the plan — from 16% on sub-$50 plans to 26% on $100+ plans. Premium software signals with round numbers; budget software seduces with 9s.
7. Free tiers, trials, and conversion
43% of tools have a genuine free tier and 59% offer a free trial. But free is a means, not an end: the median free-to-paid conversion across SaaS is just 8%. The biggest lever isn’t free vs. paid — it’s the credit card: trials that require a card upfront convert more than 5× better (25–35% vs 4–6%).
8. How SaaS charges: no single model wins anymore
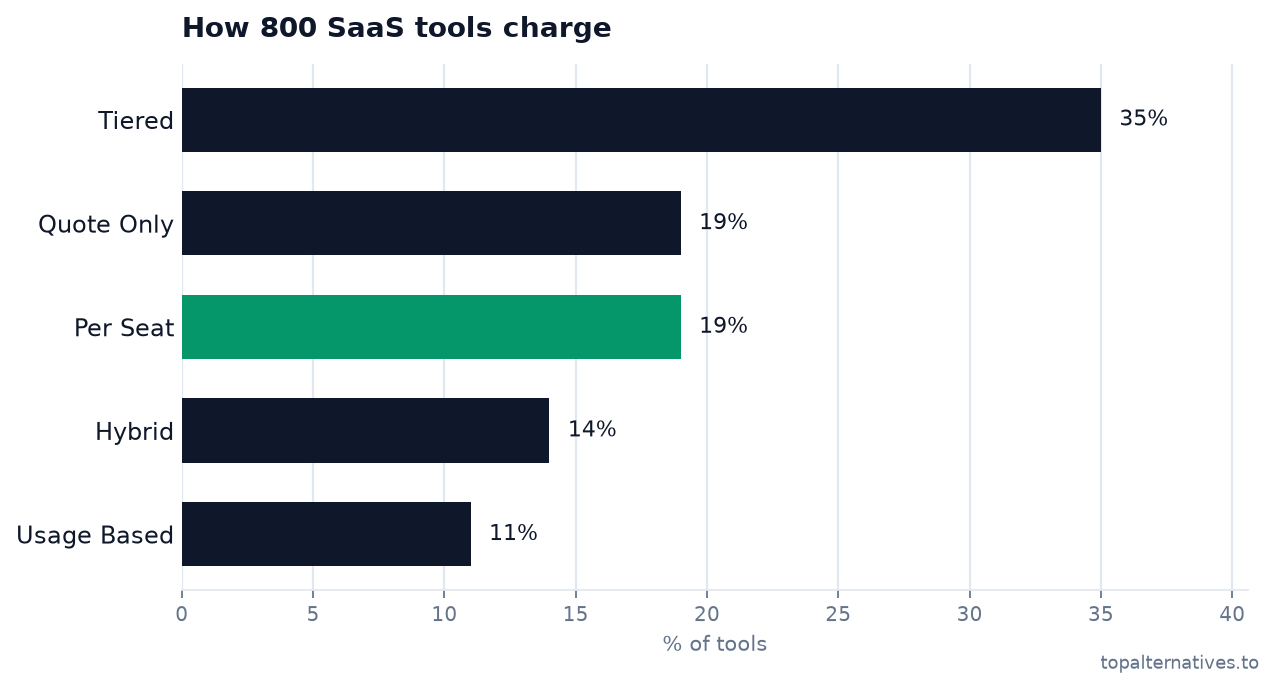
Flat-tiered pricing leads at 35%, but classic per-seat has fallen to just 19% — tied with quote-only (19%). Explicit hybrid (subscription + usage) is now 14% and pure usage-based 11%. Count every tool that carriesany usage or credit component, though, and it’s a majority (57%) — the metered future is here, it’s just wearing a subscription on top.
9. The founder’s pricing playbook (what the data says to do)
- Anchor your entry tier near $25–$49. That’s the median and the single most common price point; going far above it without a clear reason fights the market.
- Ship 2–3 tiers, not 5. That’s what most tools do. Make the second tier ~2× the first — that’s the norm buyers expect.
- End prices in 9 — unless you’re deliberately premium. 39% of the market does. If you’re positioning up-market ($100+), round numbers signal quality.
- If you have AI, meter it. 69% of AI tools already charge on usage or credits, and 67% of AI features aren’t monetized at all — that’s upside. A subscription base + usage/credits (hybrid) is now the most common structure in SaaS.
- Require a card for your free trial. It converts 5× better than a no-card trial.
- Add a quote-only enterprise tier. 20% of the market keeps a “contact sales” option, and the top tier sells for a median 3.4× the entry.
- Expect to keep changing it. The top 500 SaaS companies made 1,800+ pricing changes in 2025 (3.6 per company). Pricing is a living system, not a launch decision.
Full data by category
| Category | Tools | Median entry | Free tier | Quote-only |
|---|---|---|---|---|
| Spend & Procurement | 20 | $299 | 5% | 65% |
| Subscription Billing | 21 | $249 | 29% | 43% |
| Ad Creative Analytics | 17 | $219 | 24% | 24% |
| AI Inference & GPU Infrastructure | 24 | $129 | 25% | 0% |
| Product Analytics | 16 | $115 | 81% | 31% |
| ATS & Recruiting Software | 22 | $99 | 14% | 59% |
| Website Visitor Identification | 18 | $85 | 22% | 17% |
| AI Ad Management | 22 | $49 | 14% | 32% |
| Community Platforms | 12 | $49 | 17% | 50% |
| Field Service Management | 21 | $48 | 10% | 52% |
| ITSM & Internal Help Desk | 20 | $44 | 15% | 30% |
| Sales Intelligence & Data | 20 | $43 | 50% | 30% |
| Online Course Platforms | 15 | $42 | 33% | 7% |
| Sales Engagement & Outbound | 19 | $39 | 37% | 5% |
| Session Replay & Heatmaps | 11 | $39 | 64% | 9% |
| CMMS & Maintenance Management | 21 | $35 | 19% | 48% |
| Sales Dialers & Phone Automation | 22 | $35 | 14% | 36% |
| Website & Software Localization | 21 | $34 | 52% | 10% |
| Video Messaging & Sales Video | 20 | $33 | 70% | 5% |
| Website Chat & Chatbots | 12 | $31 | 75% | 0% |
| Creator Memberships & Monetization | 22 | $29 | 41% | 0% |
| Digital Asset Management | 21 | $27 | 29% | 48% |
| Data & Analytics Platforms | 22 | $25 | 59% | 32% |
| Customer Support & Help Desk | 20 | $25 | 25% | 20% |
| Funnel Builders & All-in-one Marketing | 14 | $25 | 14% | 7% |
| Observability & Error Monitoring | 20 | $25 | 55% | 15% |
| Accounting Software | 18 | $24 | 28% | 11% |
| AI Code Review | 21 | $20 | 62% | 0% |
| Startup Banking | 21 | $20 | 90% | 0% |
| AI Ad Creative Generators | 17 | $20 | 53% | 6% |
| E-signature & Document Workflow | 21 | $19 | 57% | 0% |
| Forms & Surveys | 20 | $19 | 75% | 15% |
| CRM & Marketing | 20 | $15 | 40% | 5% |
| AI Meeting Notetakers | 22 | $15 | 77% | 9% |
| Incident Management & On-call | 19 | $14 | 58% | 5% |
| Email Marketing & Automation | 13 | $13 | 46% | 15% |
| Website Builders | 22 | $12 | 68% | 0% |
| Docs & Knowledge Bases | 22 | $11 | 59% | 18% |
| Presentation Software | 17 | $11 | 82% | 0% |
| Meeting Scheduling | 19 | $10 | 68% | 0% |
| Project Management | 15 | $9 | 87% | 0% |
| HR & HCM | 20 | $8 | 0% | 55% |
Methodology & sources
We compiled published pricing for 800 tools across 42 categories. Each entry price is the lowest paid monthly plan on the vendor’s page (or the lowest paid tier where no starting price is listed), re-verified from source and dated. A tool is flagged as having a “usage/credit component” if its model is usage-based, its starting price is metered, or its tiers reference credits, tokens, overages, or per-unit charges. Category medians use categories with at least three priced tools. External benchmarks are attributed inline to Bessemer, ICONIQ, ChartMogul, Kyle Poyar / Growth Unhinged, OpenView, and Benchmarkit; figures are 2025–2026 vintage and this space moves fast. See our full methodology, the companion statistics page, or download the raw CSV.
Cite or embed this report
This research is free to reference under CC BY 4.0 — just link back to the source.
Citation
TopAlternativesTo, "The State of SaaS Pricing 2026," https://topalternatives.to/state-of-saas-pricingEmbed a chart (copy & paste)
Drop any chart into your article — the embed credits the source automatically.
<a href="https://topalternatives.to/state-of-saas-pricing">
  <img src="https://topalternatives.to/report-charts/usage-adoption.png"
       alt="The State of SaaS Pricing 2026" width="640" />
</a>
<p>Source: <a href="https://topalternatives.to/state-of-saas-pricing">State of SaaS Pricing 2026</a> by TopAlternativesTo</p>