Top Datadog Alternatives in 2026
Here for Datadog itself? See the full Datadog profile, pricing & reviews →
Suggest a change- If you want a Datadog-style all-in-one platform (infra, APM, logs, traces) without a total architecture change, choose New Relic. New Relic covers the same infra, APM, logs, and tracing surface as Datadog under one query language, and its free tier includes 100 GB of ingest a month before anything is billed.
- If you already run Prometheus, Loki, or Tempo and just want a dashboard and alerting layer instead of paying Datadog to replace them, choose Grafana. Grafana's open source core is free to self-host, and Grafana Cloud lets you keep the same dashboards while skipping Datadog's per-host agent billing entirely.
- If your incidents live in high-cardinality fields like user ID, build version, or region rather than in a CPU or memory graph, choose Honeycomb. Honeycomb's BubbleUp feature automatically finds which dimensions differ in an anomaly, a query pattern Datadog's metrics-first model was not built to answer as fast.
- If you need to keep full-fidelity logs and traces at high volume without paying Datadog's per-GB indexing rate, choose Axiom. Axiom's compression keeps storage cheap and its $25/month base plan includes 1,000 GB of monthly ingest, well past what Datadog charges to index the same volume of logs.
- If you mainly need error tracking and APM tied to your releases, not infrastructure or host monitoring, choose Sentry. Sentry's unlimited-seat pricing is built around error and trace volume rather than the host count Datadog uses, so a team that never needed infra monitoring stops paying for it.
- If you already have Datadog rolled out across a large fleet and depend on its integration catalog and unified security tooling, choose stay on Datadog. No single alternative on this list matches Datadog's combined breadth of integrations, DevSecOps tooling, and infra plus APM plus log coverage in one product, so migrating away from a mature deployment is rarely worth the disruption.
Datadog bundles infrastructure monitoring, APM, and logs into one platform, but its usage-based pricing meters each of those separately. Host counts, custom metric tag combinations, and log indexing all bill on their own meter, so the total on your invoice rarely matches the number on the pricing page. Teams who get hit with a surprise bill after an autoscaling event, or who tagged too many custom metrics, start looking elsewhere.
The alternatives below do the same core job, catching production issues before your customers do, with different tradeoffs: broader all-in-one platforms, open source stacks you can self-host, and tools that price by event or ingest volume instead of host count.
Datadog alternatives compared
| Tool | Best for | Starting price | Free option | Last update |
|---|---|---|---|---|
| New RelicBest all-in-one replacement | Teams that want one platform for APM, infra, logs, and traces instead of running several separate tools | $10/seat/mo | Yes | June 2026 |
| GrafanaBest for avoiding vendor lock-in | Teams that already run Prometheus, Loki, or Tempo and just want a dashboard layer on top | $19/mo | Yes | June 2026 |
| HoneycombBest for high-cardinality debugging | Teams debugging production issues that need to slice traces by arbitrary high-cardinality fields (user, request ID, feature flag) instead of a fixed dashboard | $150/mo | Yes | June 2026 |
| AxiomBest value at high log volume | Teams that want to keep full-fidelity logs and traces at high volume without paying per-host or per-GB-ingested list price | $25/mo | Yes | June 2026 |
| Sentry | Engineering teams that want error alerts tied directly to the code and release that broke | $26/mo | Yes | July 2026 |
Why teams switch from Datadog
Cloud integrations pull in metrics you didn't ask for
Turning on the AWS integration auto-collects CloudWatch metrics, including ones with no official Datadog integration, and those roll straight into your custom metrics allocation, a common source of surprise charges.
A multi-day autoscaling spike sets the whole month's host bill
Datadog's host billing only drops the top 1% of hourly readings in a month and bills the rest at that peak, so a spike lasting more than a day or two, not a brief blip, can set the entire month's charge. Running the Agent as a sidecar instead of a DaemonSet can also make every pod count as its own billable host.
Custom metrics multiply with every tag you add
A custom metric is billed per unique combination of metric name and tag values, including the host tag, so adding a tag like user ID can turn one metric into thousands of billable ones.
The best Datadog alternatives, ranked
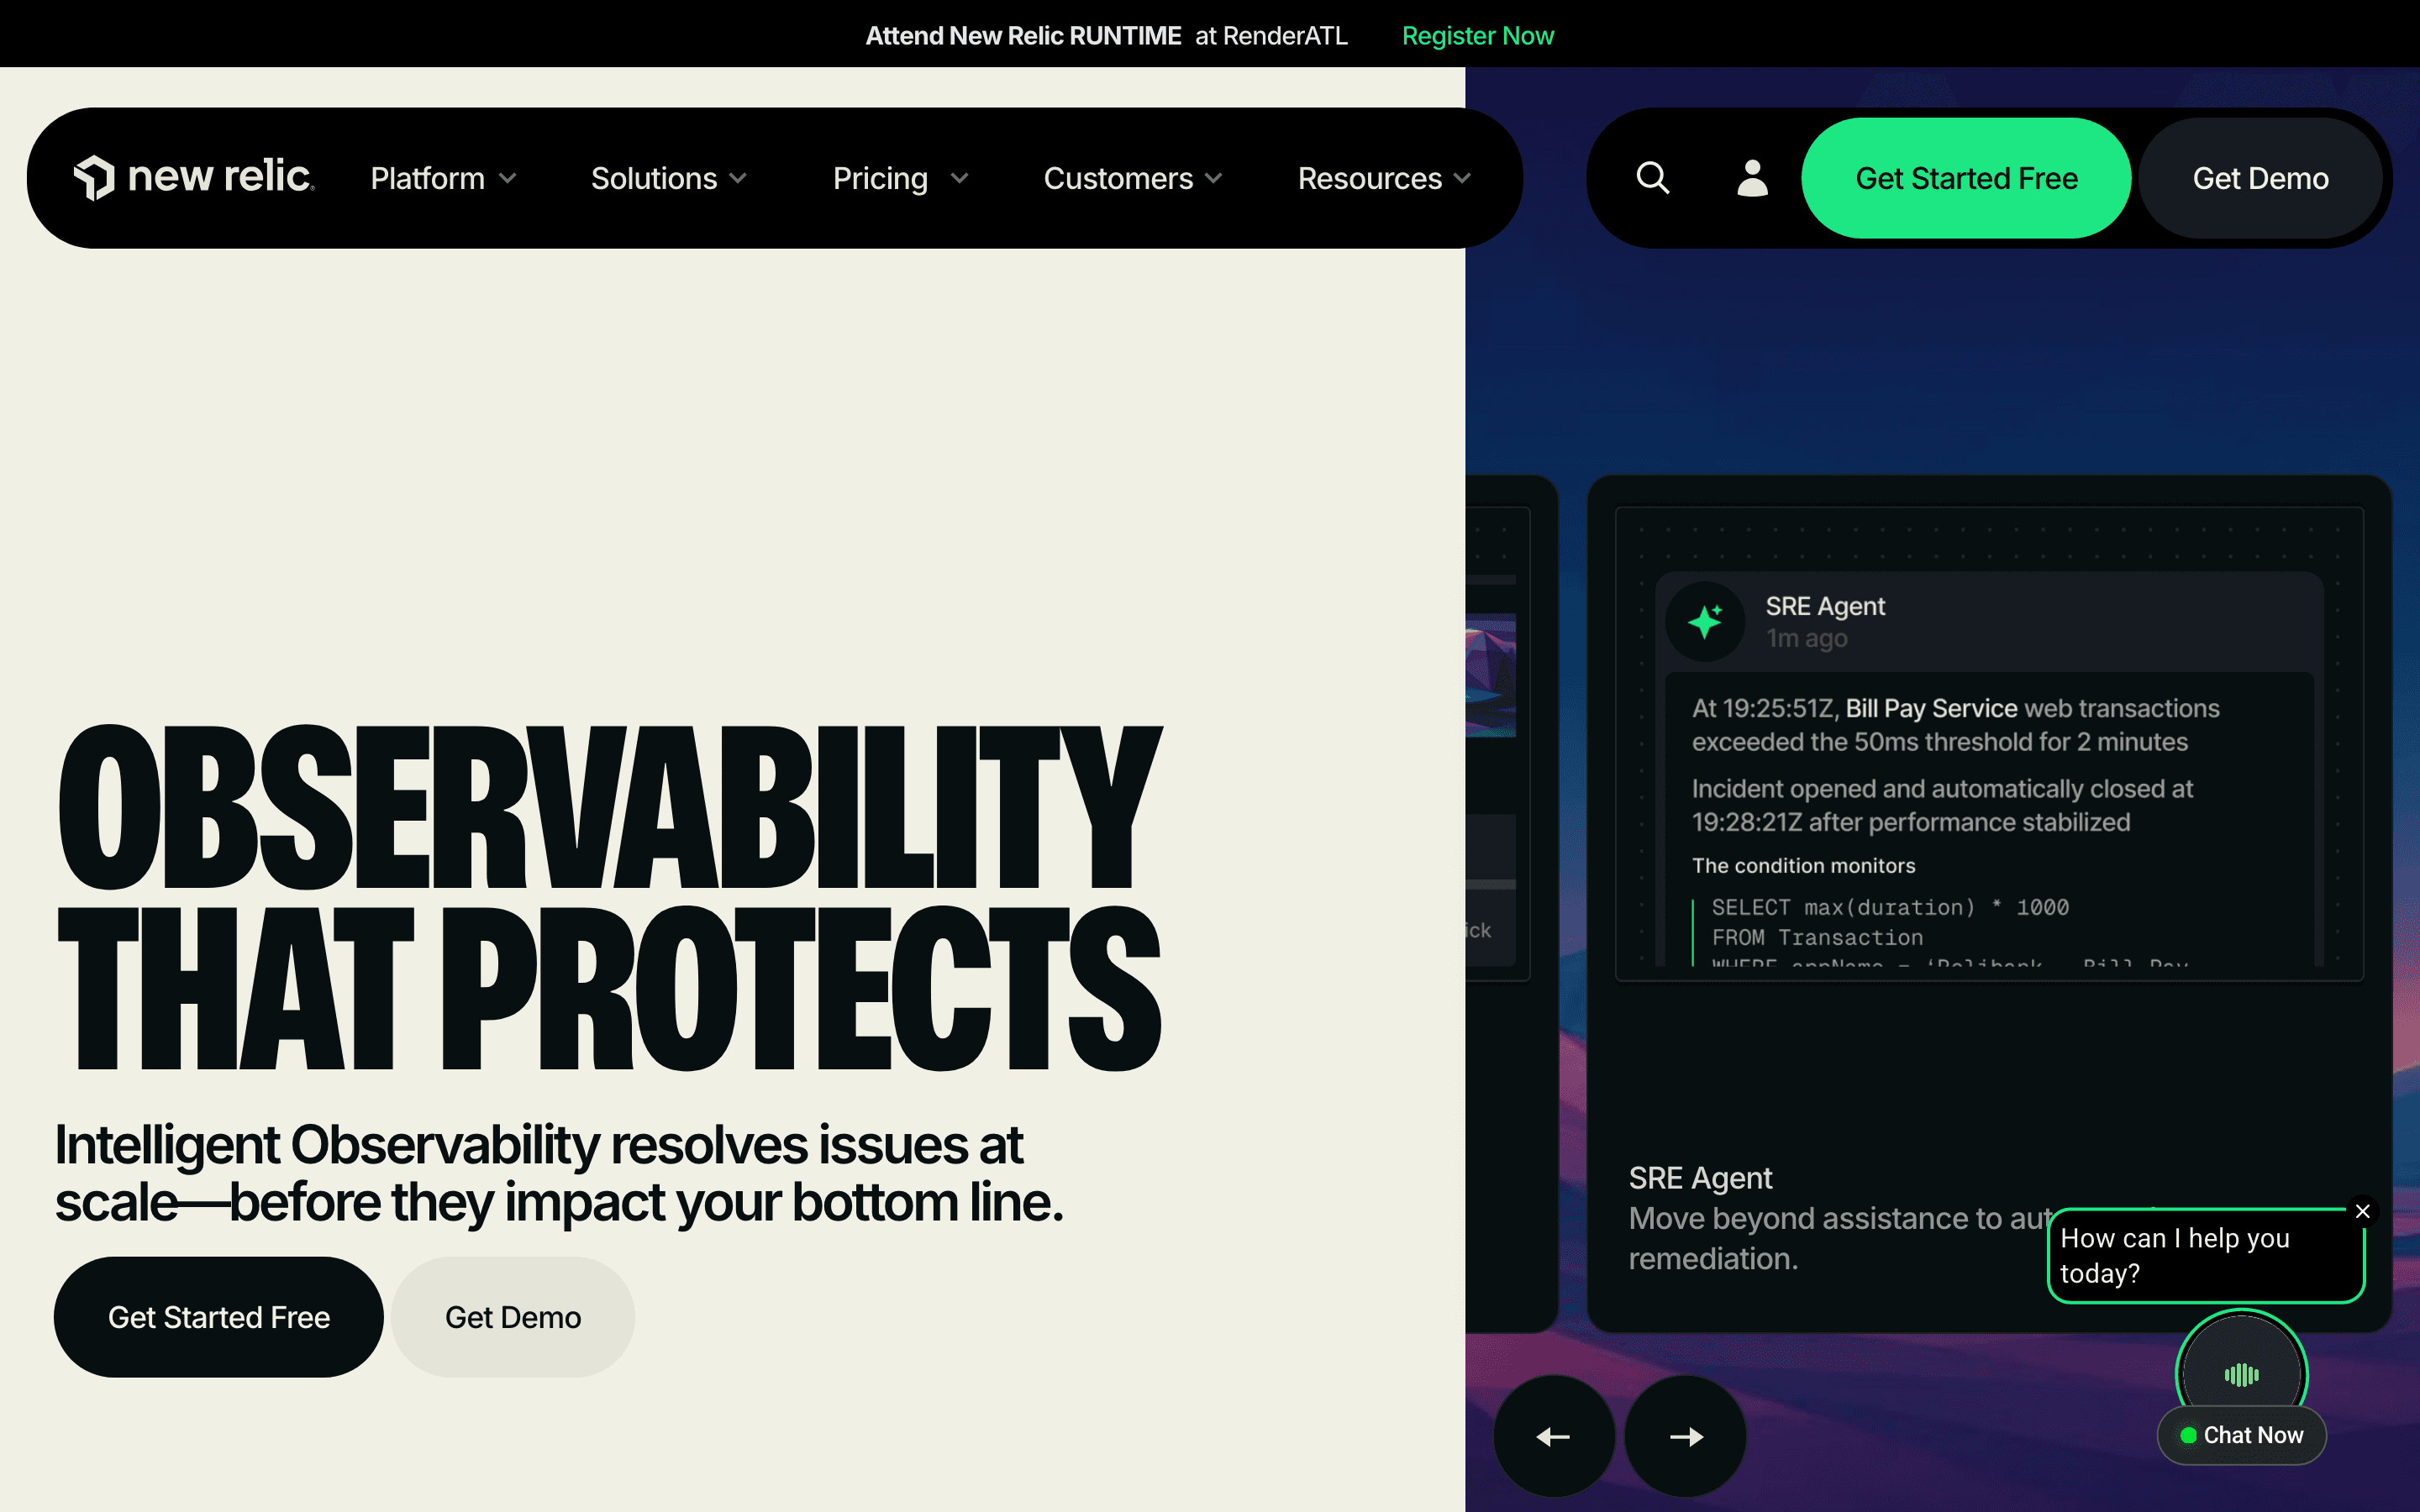
New Relic is the closest like-for-like swap for Datadog: infrastructure monitoring, APM, distributed tracing, logs, and synthetics all live in one platform, queried through NRQL instead of Datadog's own query layer. The free plan is genuinely useful, 100 GB of ingest a month and one full platform user, no credit card needed. The catch is New Relic's own pricing has two dials instead of Datadog's many: a per-seat fee for full platform access, $99 to $418.80 a user per month depending on plan, plus data ingest overage. That means giving your whole on-call rotation real incident access, not just read-only dashboards, costs real money. Teams on New Relic's older legacy plans have also reported bills roughly doubling at renewal. Still, if the appeal of Datadog was having one tool instead of five, New Relic keeps that promise closest to intact.
Pros
- + One platform covers APM, infrastructure, logs, traces, and synthetics, so you're not paying for and maintaining separate tools
- + Genuinely useful free tier: 100 GB/month ingest and one full platform user, no credit card required
- + NRQL gives you a real query language across all your telemetry instead of a fixed set of dashboards
Cons
- – Full platform seats, the tier that unlocks APM and distributed tracing, cost $99-$418.80/month depending on plan, so giving your whole team incident access gets expensive fast
- – Engineers on cheaper Core or Basic seats can't see APM or tracing during an incident, which pushes teams toward screen-sharing with a licensed colleague
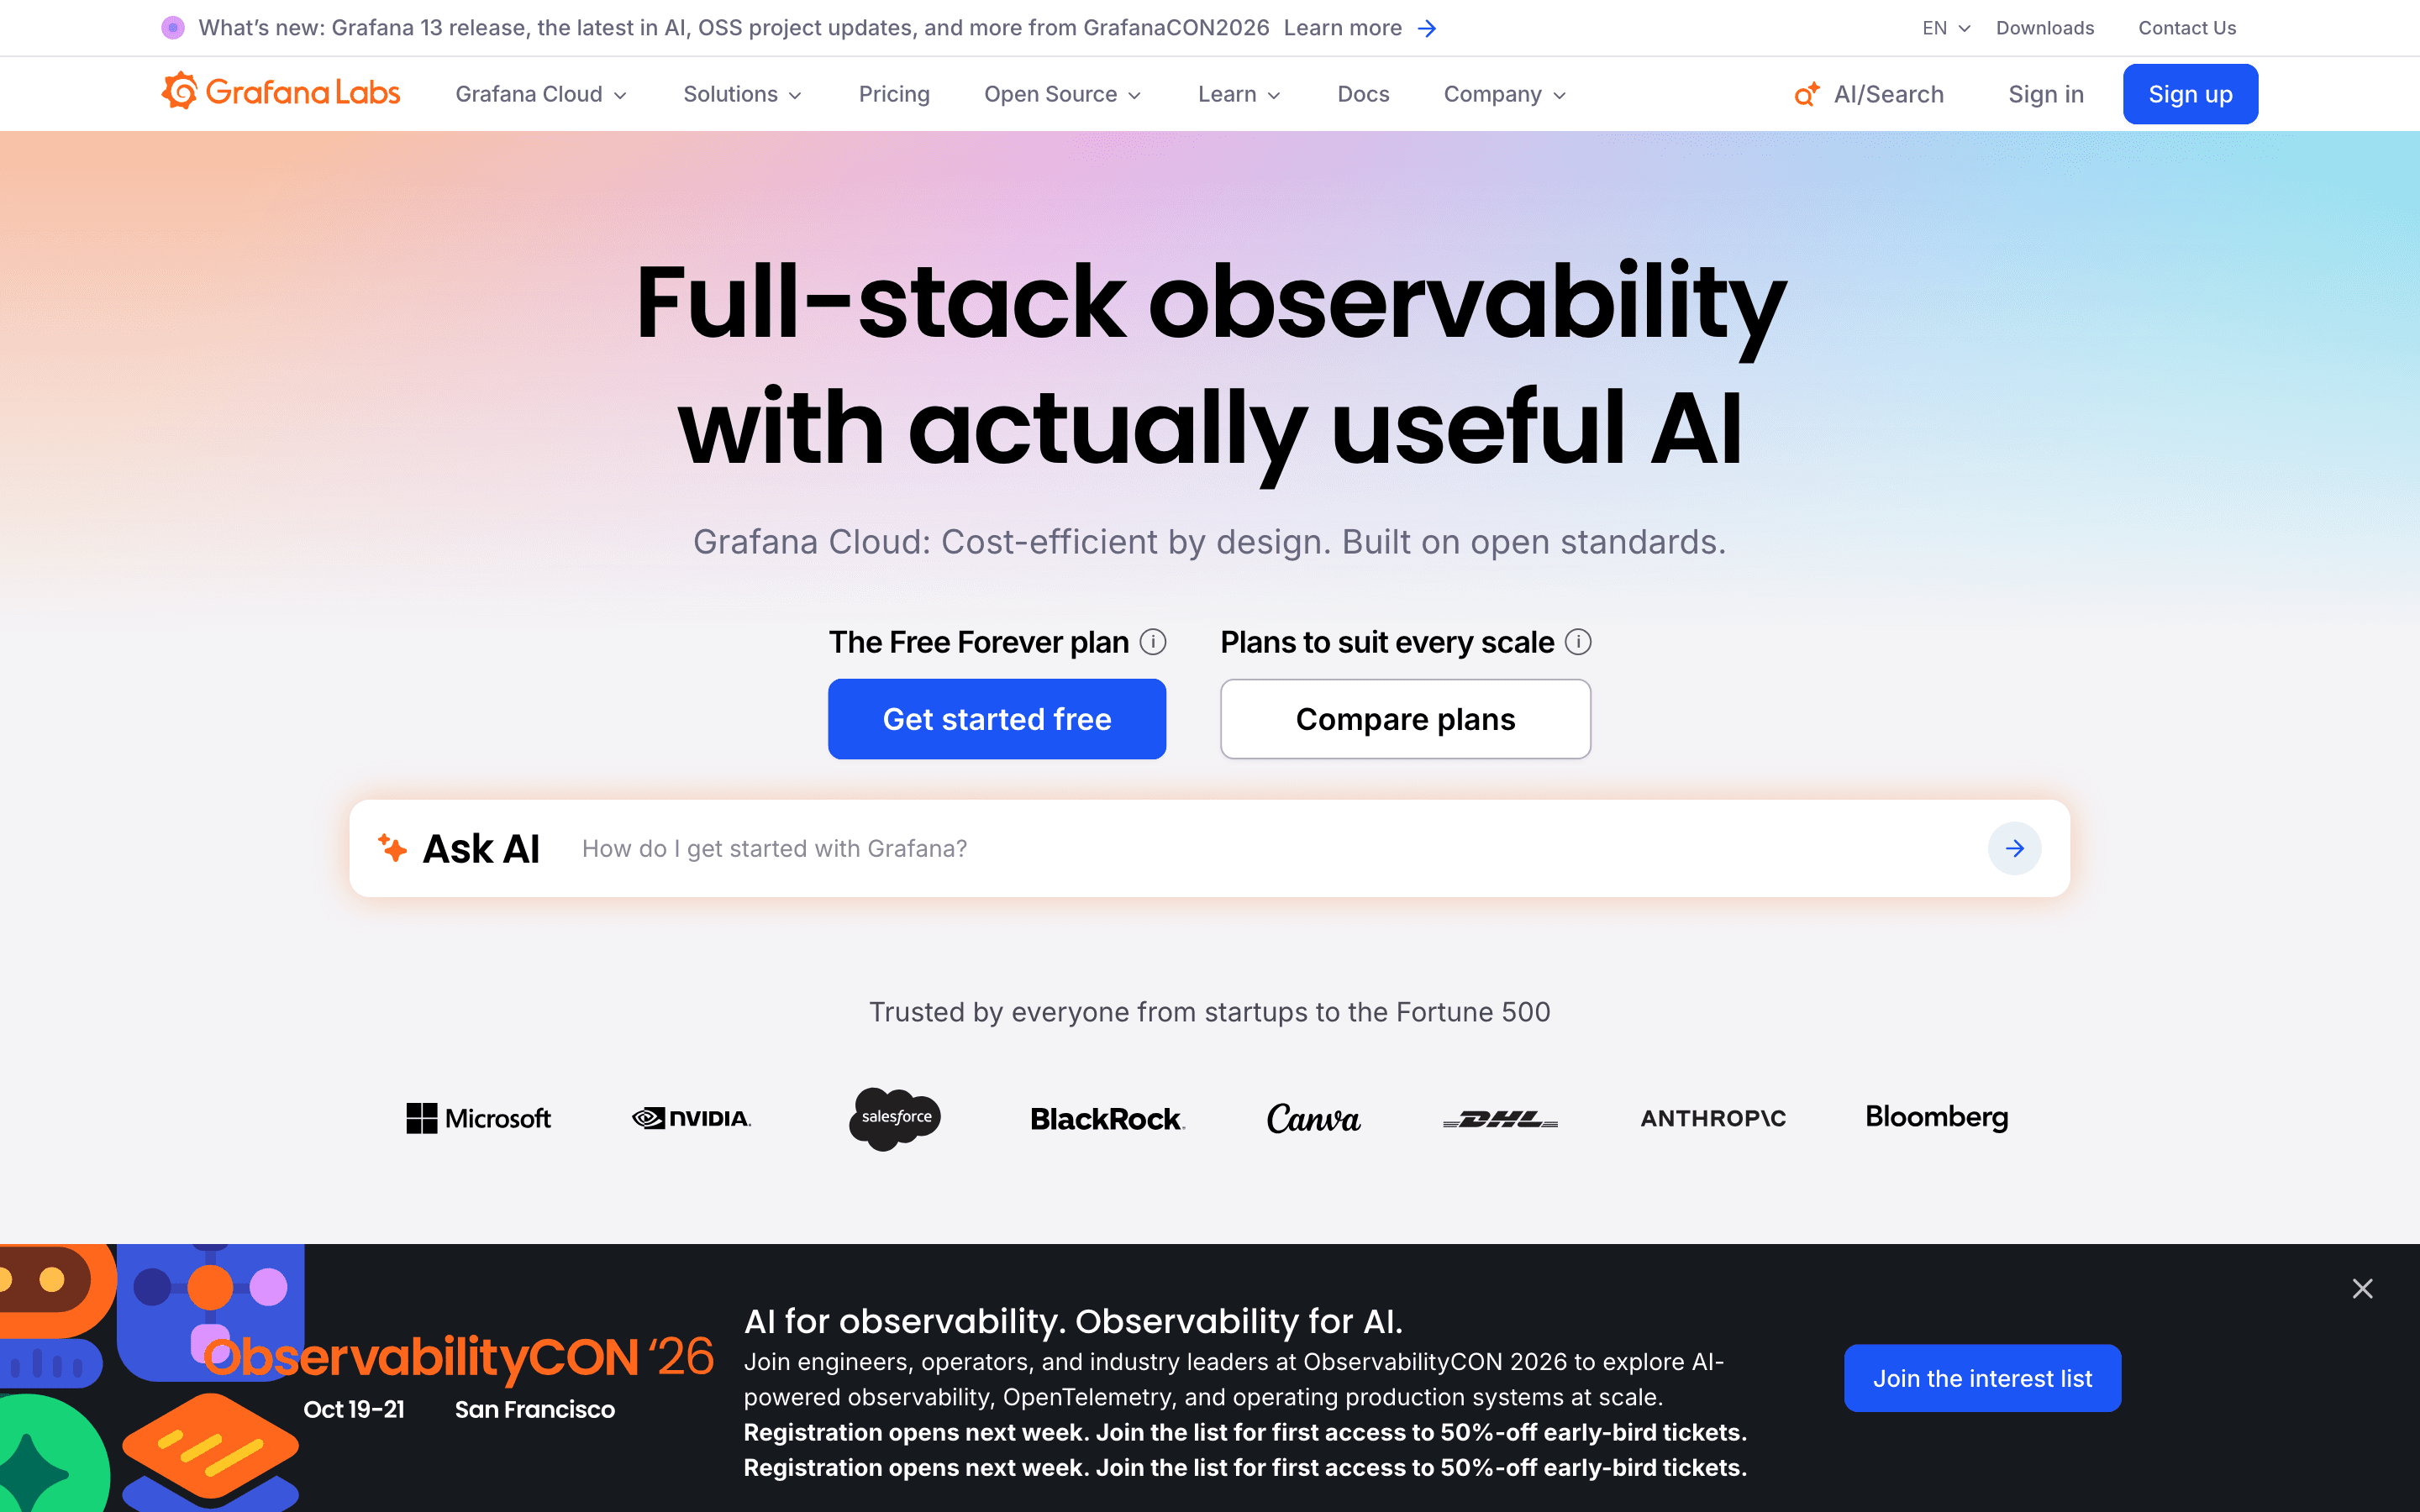
Grafana is the pick for teams that want to stop paying Datadog's agent-and-host tax and take back the infrastructure underneath their dashboards. The open source core, plus Loki for logs, Tempo for traces, and Mimir for metrics, can run entirely self-hosted for the cost of your own servers, or you can run Grafana Cloud and get a real free tier: 10k metric series and 50 GB each of logs, traces, and profiles a month. The tradeoff is that Grafana Cloud's own usage meters, metrics driven by cardinality rather than volume in particular, can climb just as fast as Datadog's once a Kubernetes cluster starts generating six-figure series counts. Teams already running Prometheus or Loki, or comfortable owning that stack themselves, get the most value here. Teams who wanted Datadog specifically to avoid running that infrastructure will find Grafana's self-hosted option less appealing.
Pros
- + Real free forever tier: 10k metric series and 50 GB each of logs, traces, and profiles per month, no credit card
- + Self-hosting the open-source core is a genuine option, not just a marketing claim, so you're never fully locked into the cloud bill
- + Volume discounts kick in automatically as usage grows, and Adaptive Metrics/Adaptive Logs can cut ingested volume automatically
Cons
- – Metrics pricing is driven by cardinality, not raw data volume, so adding labels or a second Kubernetes cluster can multiply your series count and your bill far faster than you'd expect
- – Costs are metered across seven or more independent dimensions (metrics, logs, traces, profiles, k6, synthetics, hosts), each with its own rate, which makes the bill hard to forecast
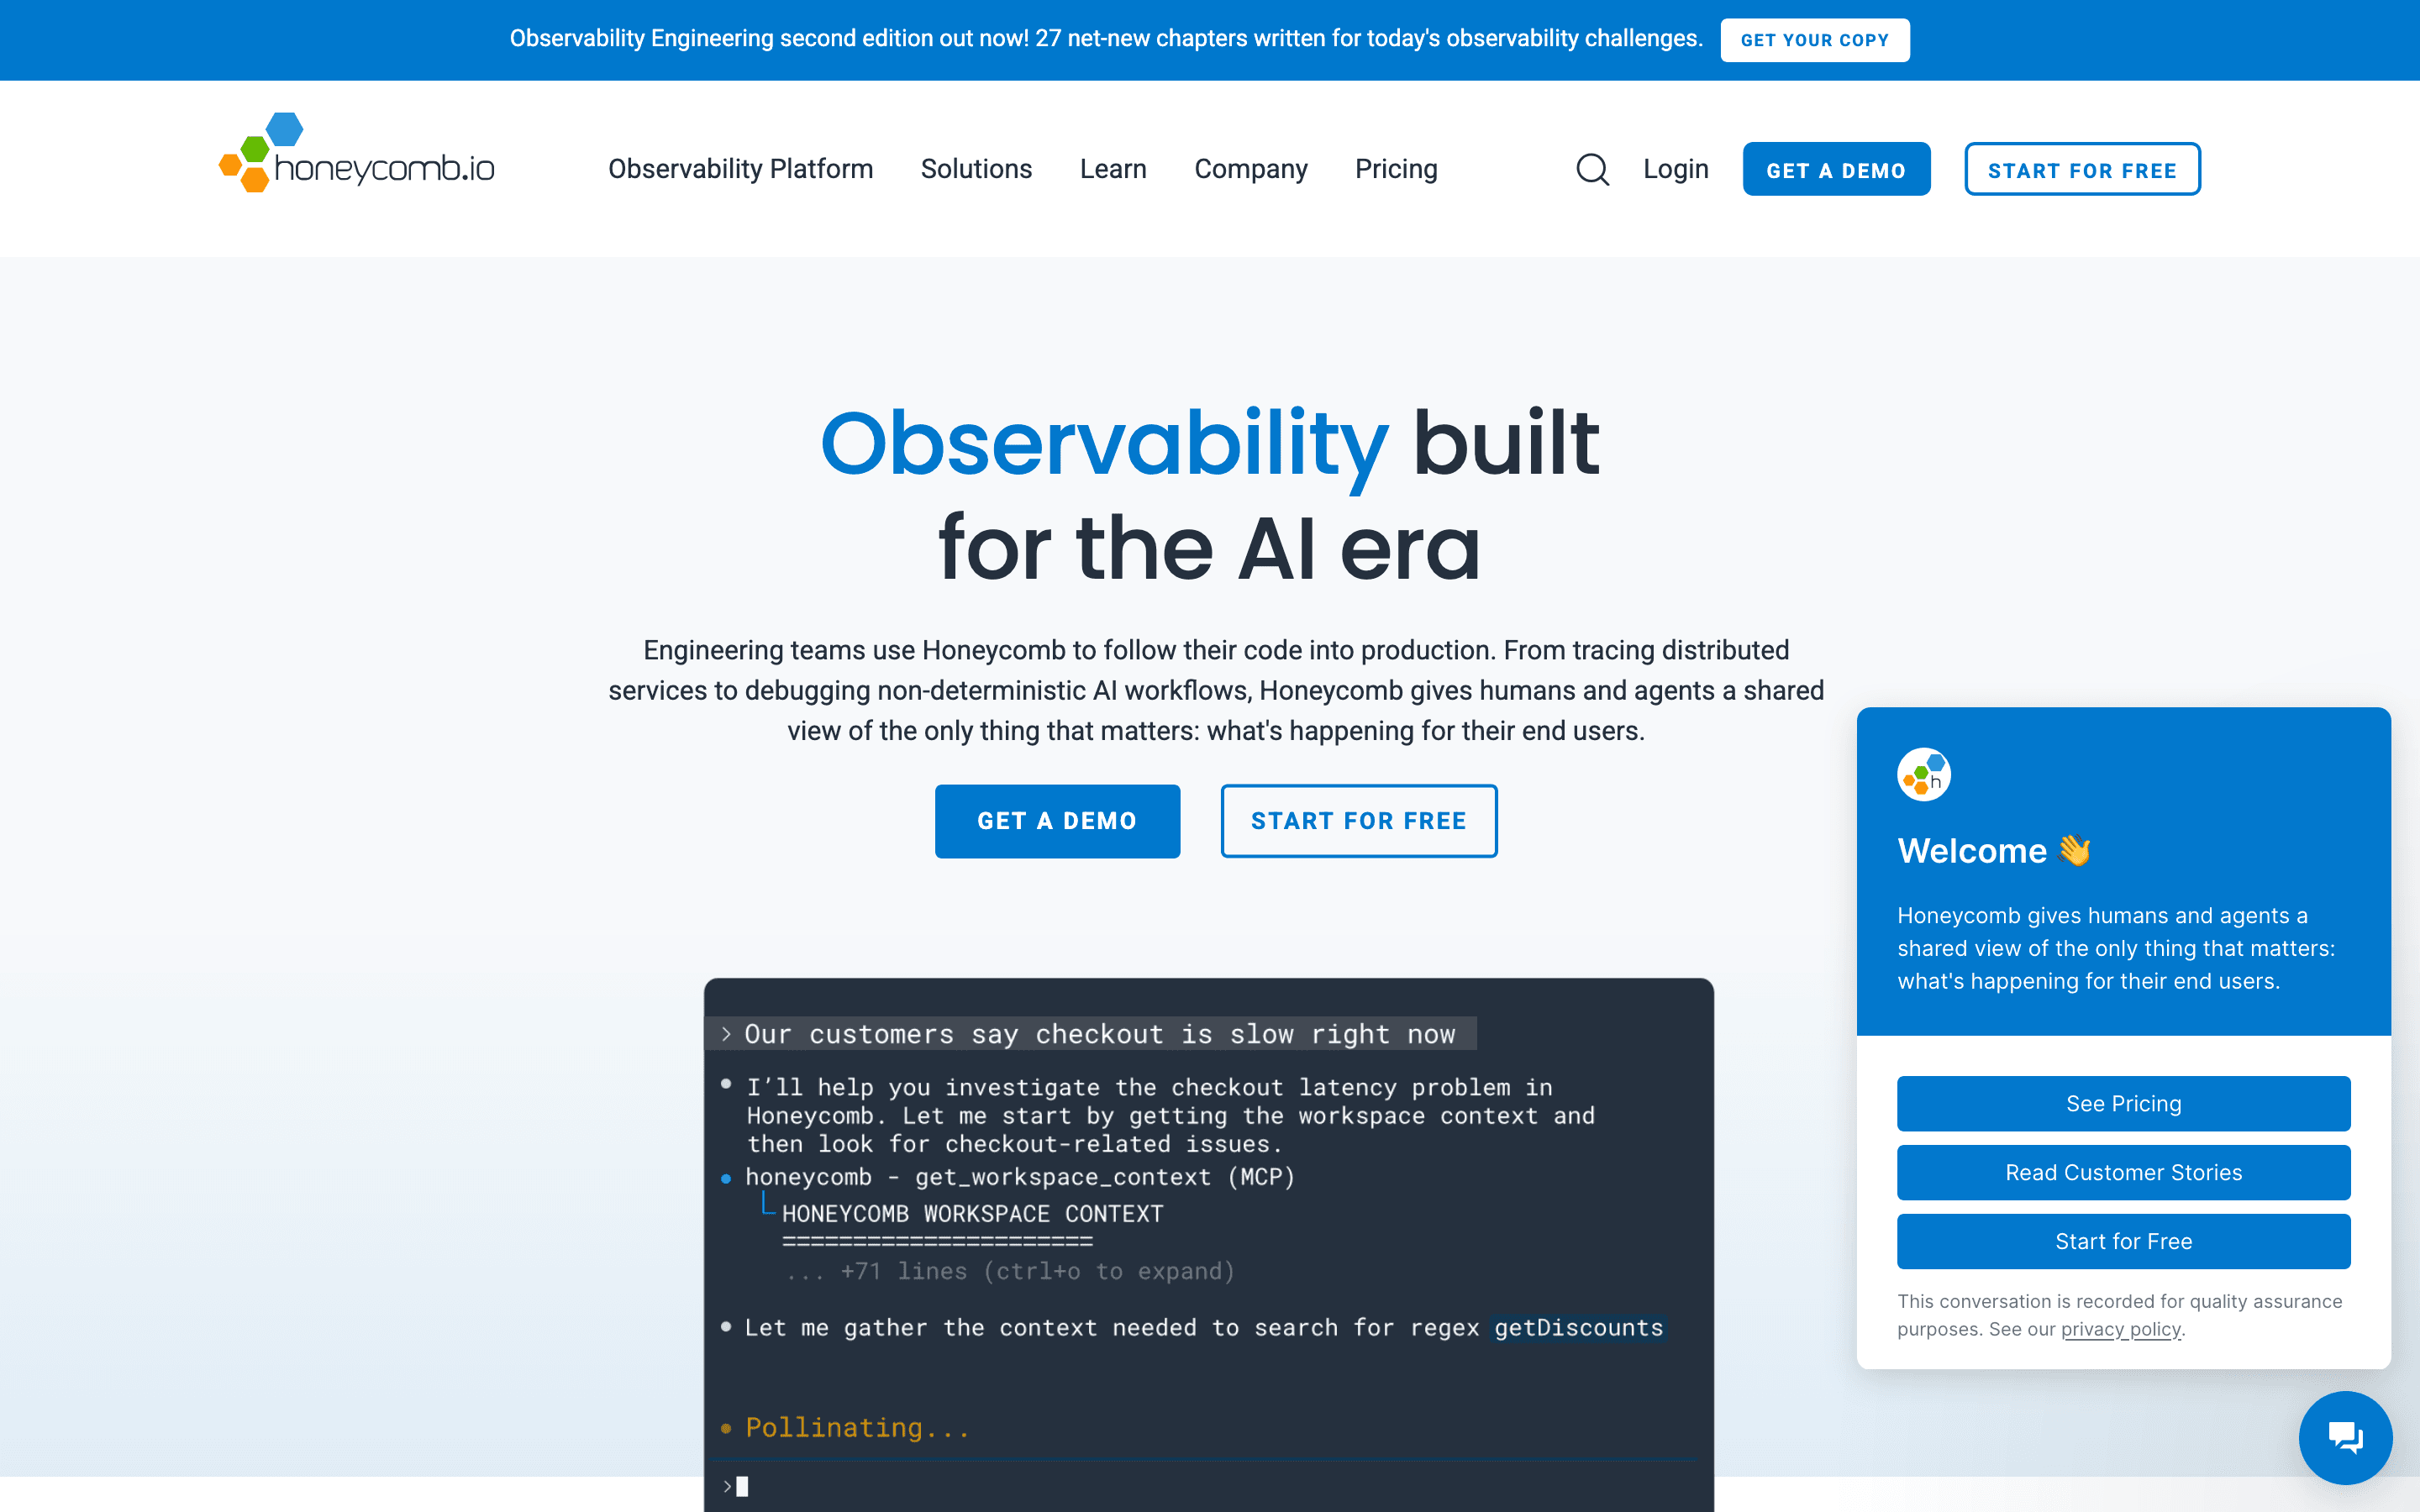
Honeycomb is not a full Datadog replacement, it does not do infrastructure or host monitoring, but for the specific job of debugging production issues buried in high-cardinality data, it does something Datadog's metrics-first model was not built for. BubbleUp draws a box around an anomaly in a graph and surfaces which fields, user ID, region, build version, actually differ in that group, instead of making an engineer click through pre-built dashboards guessing at a cause. Pricing is per event ingested, not per host, so it skips Datadog's custom-metric-cardinality billing trap entirely. The free tier covers 20M events and 100M metrics points a month, with unlimited seats on every paid tier. Teams that keep Datadog around only for infra monitoring, paired with Honeycomb for trace-level debugging, are a common combination rather than a full swap.
Pros
- + BubbleUp finds the differentiating dimensions of an anomaly automatically instead of making you guess which graph to check next
- + Query latency stays fast even on very high-cardinality fields, which is the specific weakness of most metrics-first tools
- + Free tier is genuinely usable for small projects at 20M events and 100M metrics points a month
Cons
- – Bill scales with event volume, so a spike in trace volume or an unsampled deploy can jump your usage without any seat or infra change
- – Enterprise pricing is quote-only, so budgeting past Pro's ~750M events/month requires a sales conversation
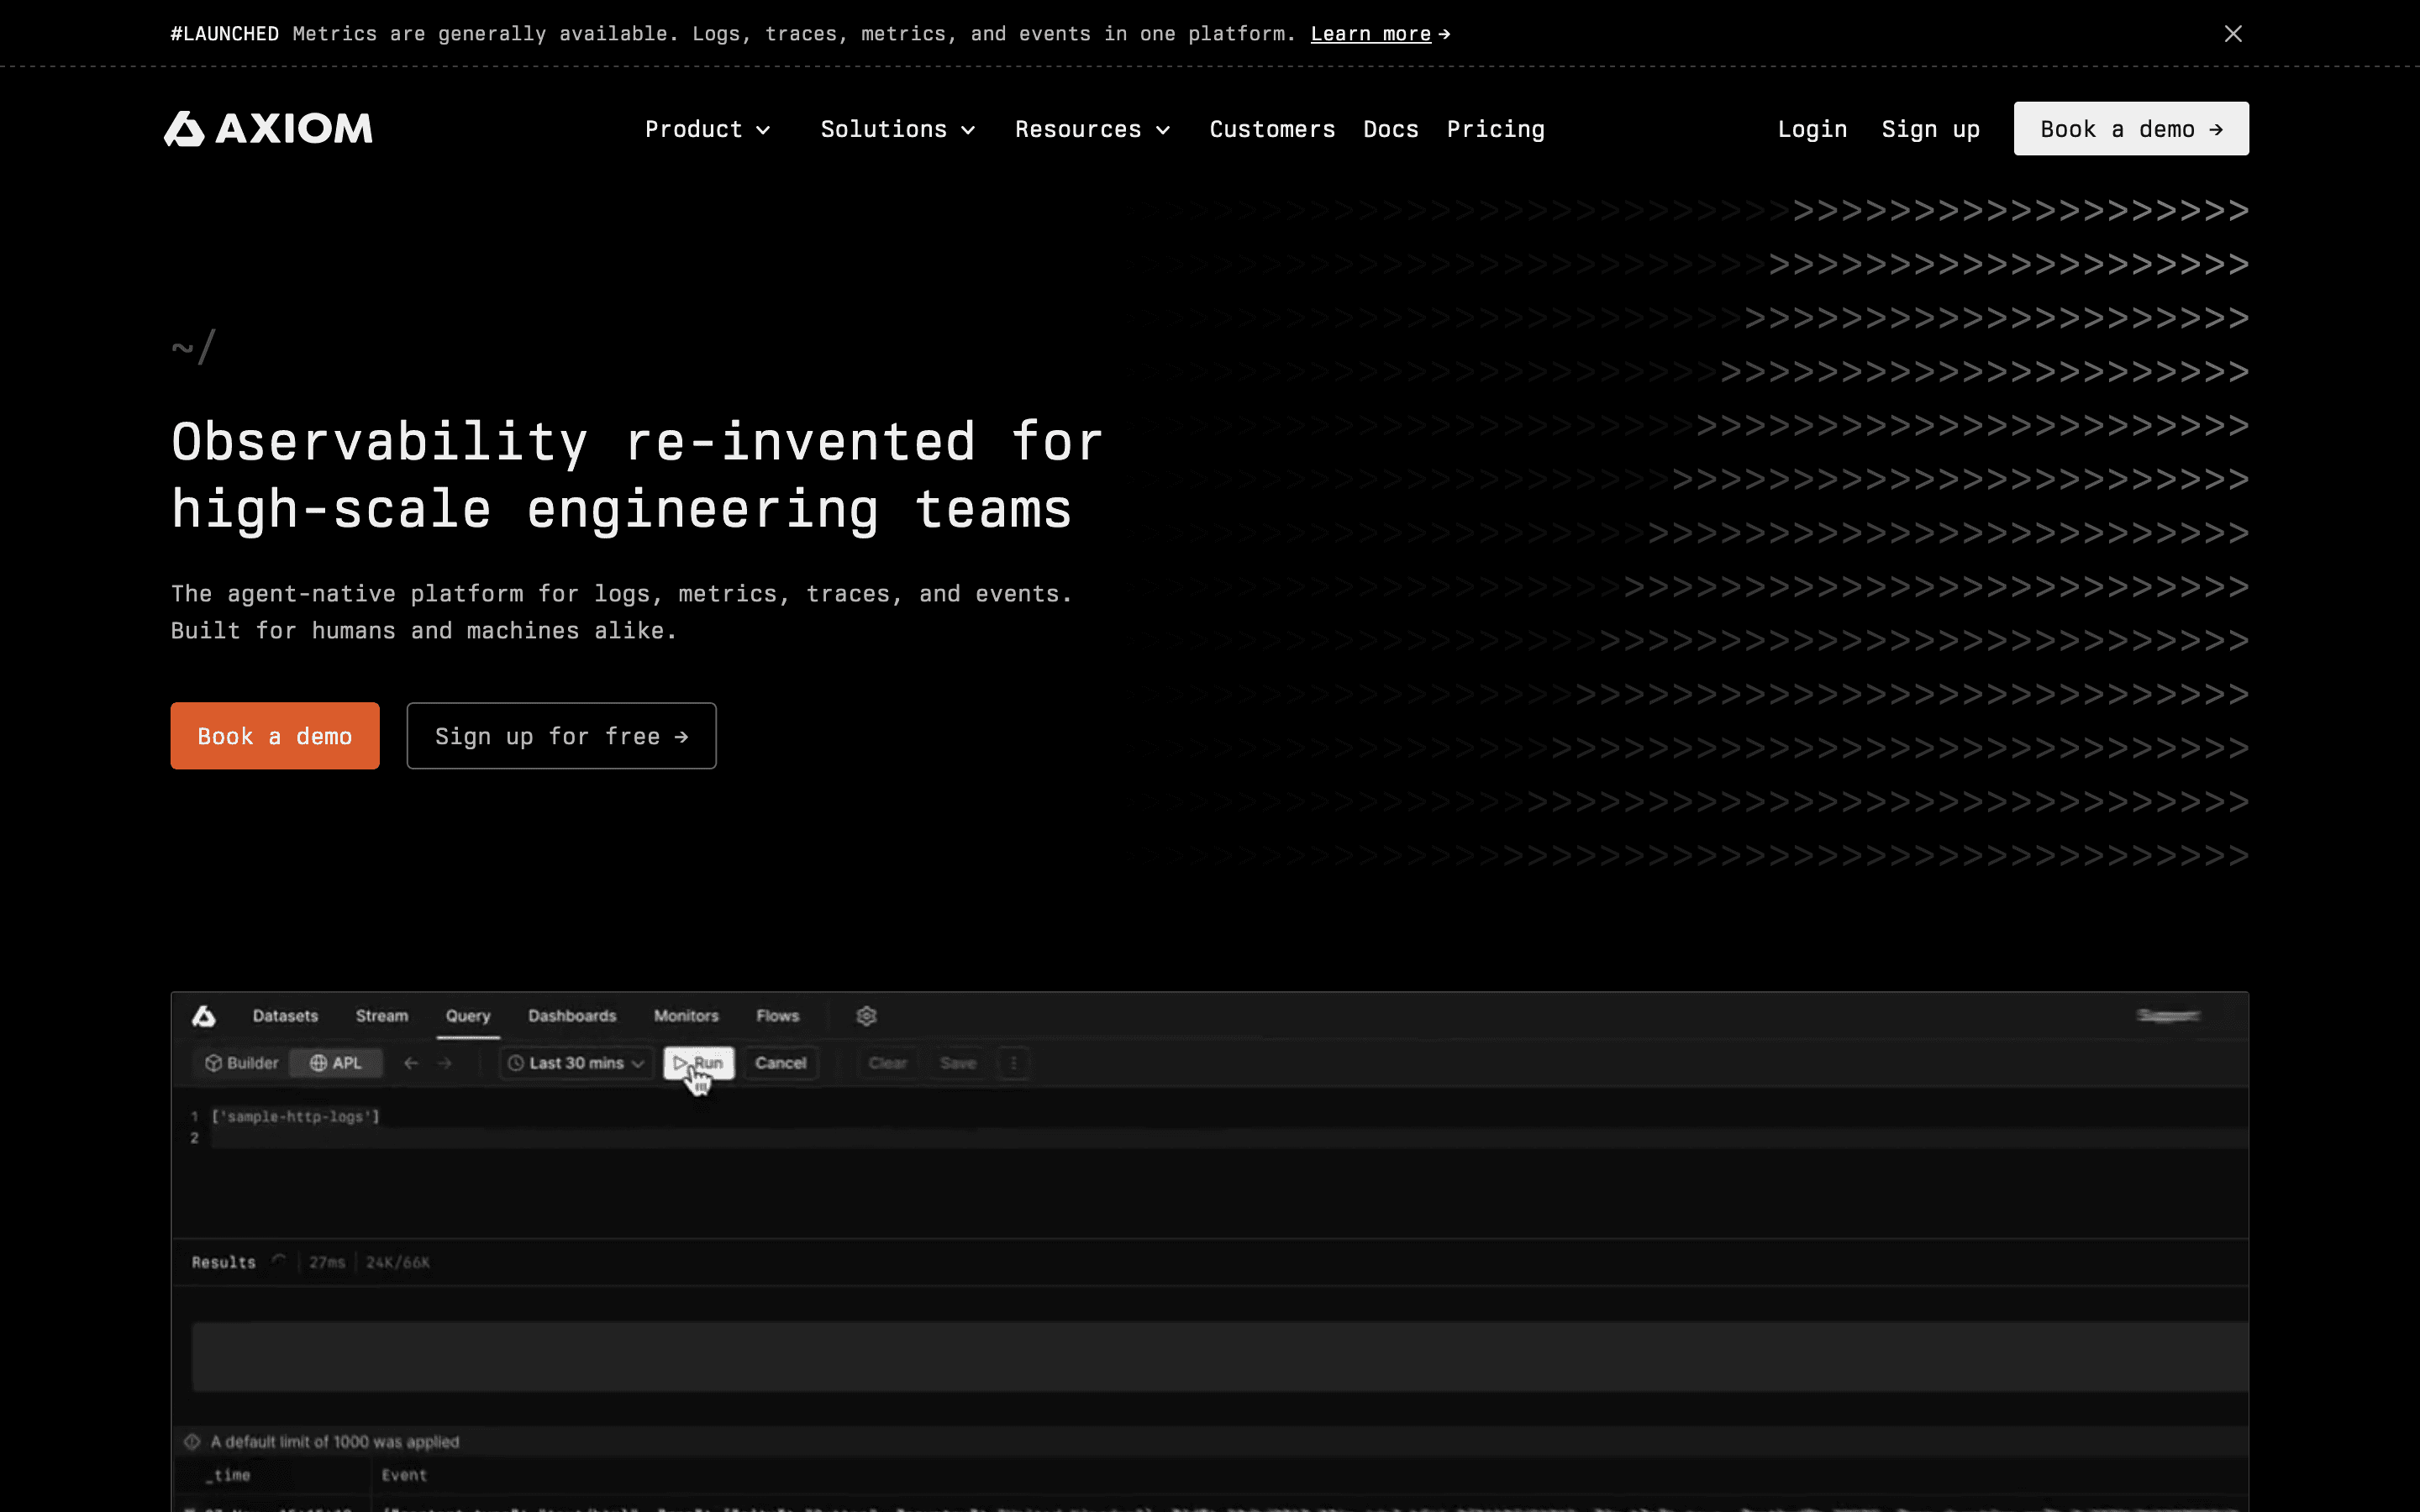
Axiom is the alternative for teams whose Datadog bill is dominated by log and trace ingestion rather than host count. Its compression keeps storage cheap, and the $25/month Cloud plan includes 1,000 GB of data loading before metered credits kick in, well past what Datadog charges per GB to index the same logs. There is no per-seat or per-host charge at all, and up to 100 users are included at no extra cost. The gap is APM: Axiom's metrics and dashboards are newer and thinner than a dedicated APM tool, so teams that lean on Datadog's tracing and profiling for incident response will find Axiom's coverage lighter. Query compute is metered too, so running a lot of ad hoc queries during an actual incident, exactly when you need to, can add to the bill faster than expected.
Pros
- + Generous always-free allowance (500 GB ingest, 25 GB storage) that's usable for real small projects, not just a trial
- + No minimum commitment on the paid plan, just a $25/month base fee plus metered usage
- + Storage costs are low because of Axiom's compression, so keeping long retention windows doesn't get expensive the way it does on per-GB-stored tools
Cons
- – Query compute is metered, so a bad incident where you're running lots of ad hoc queries and refreshing dashboards can spike your bill right when you're already under pressure
- – The Bring Your Own Cloud plan for data residency has no published price, so teams have to talk to sales to even get a ballpark
Sentry
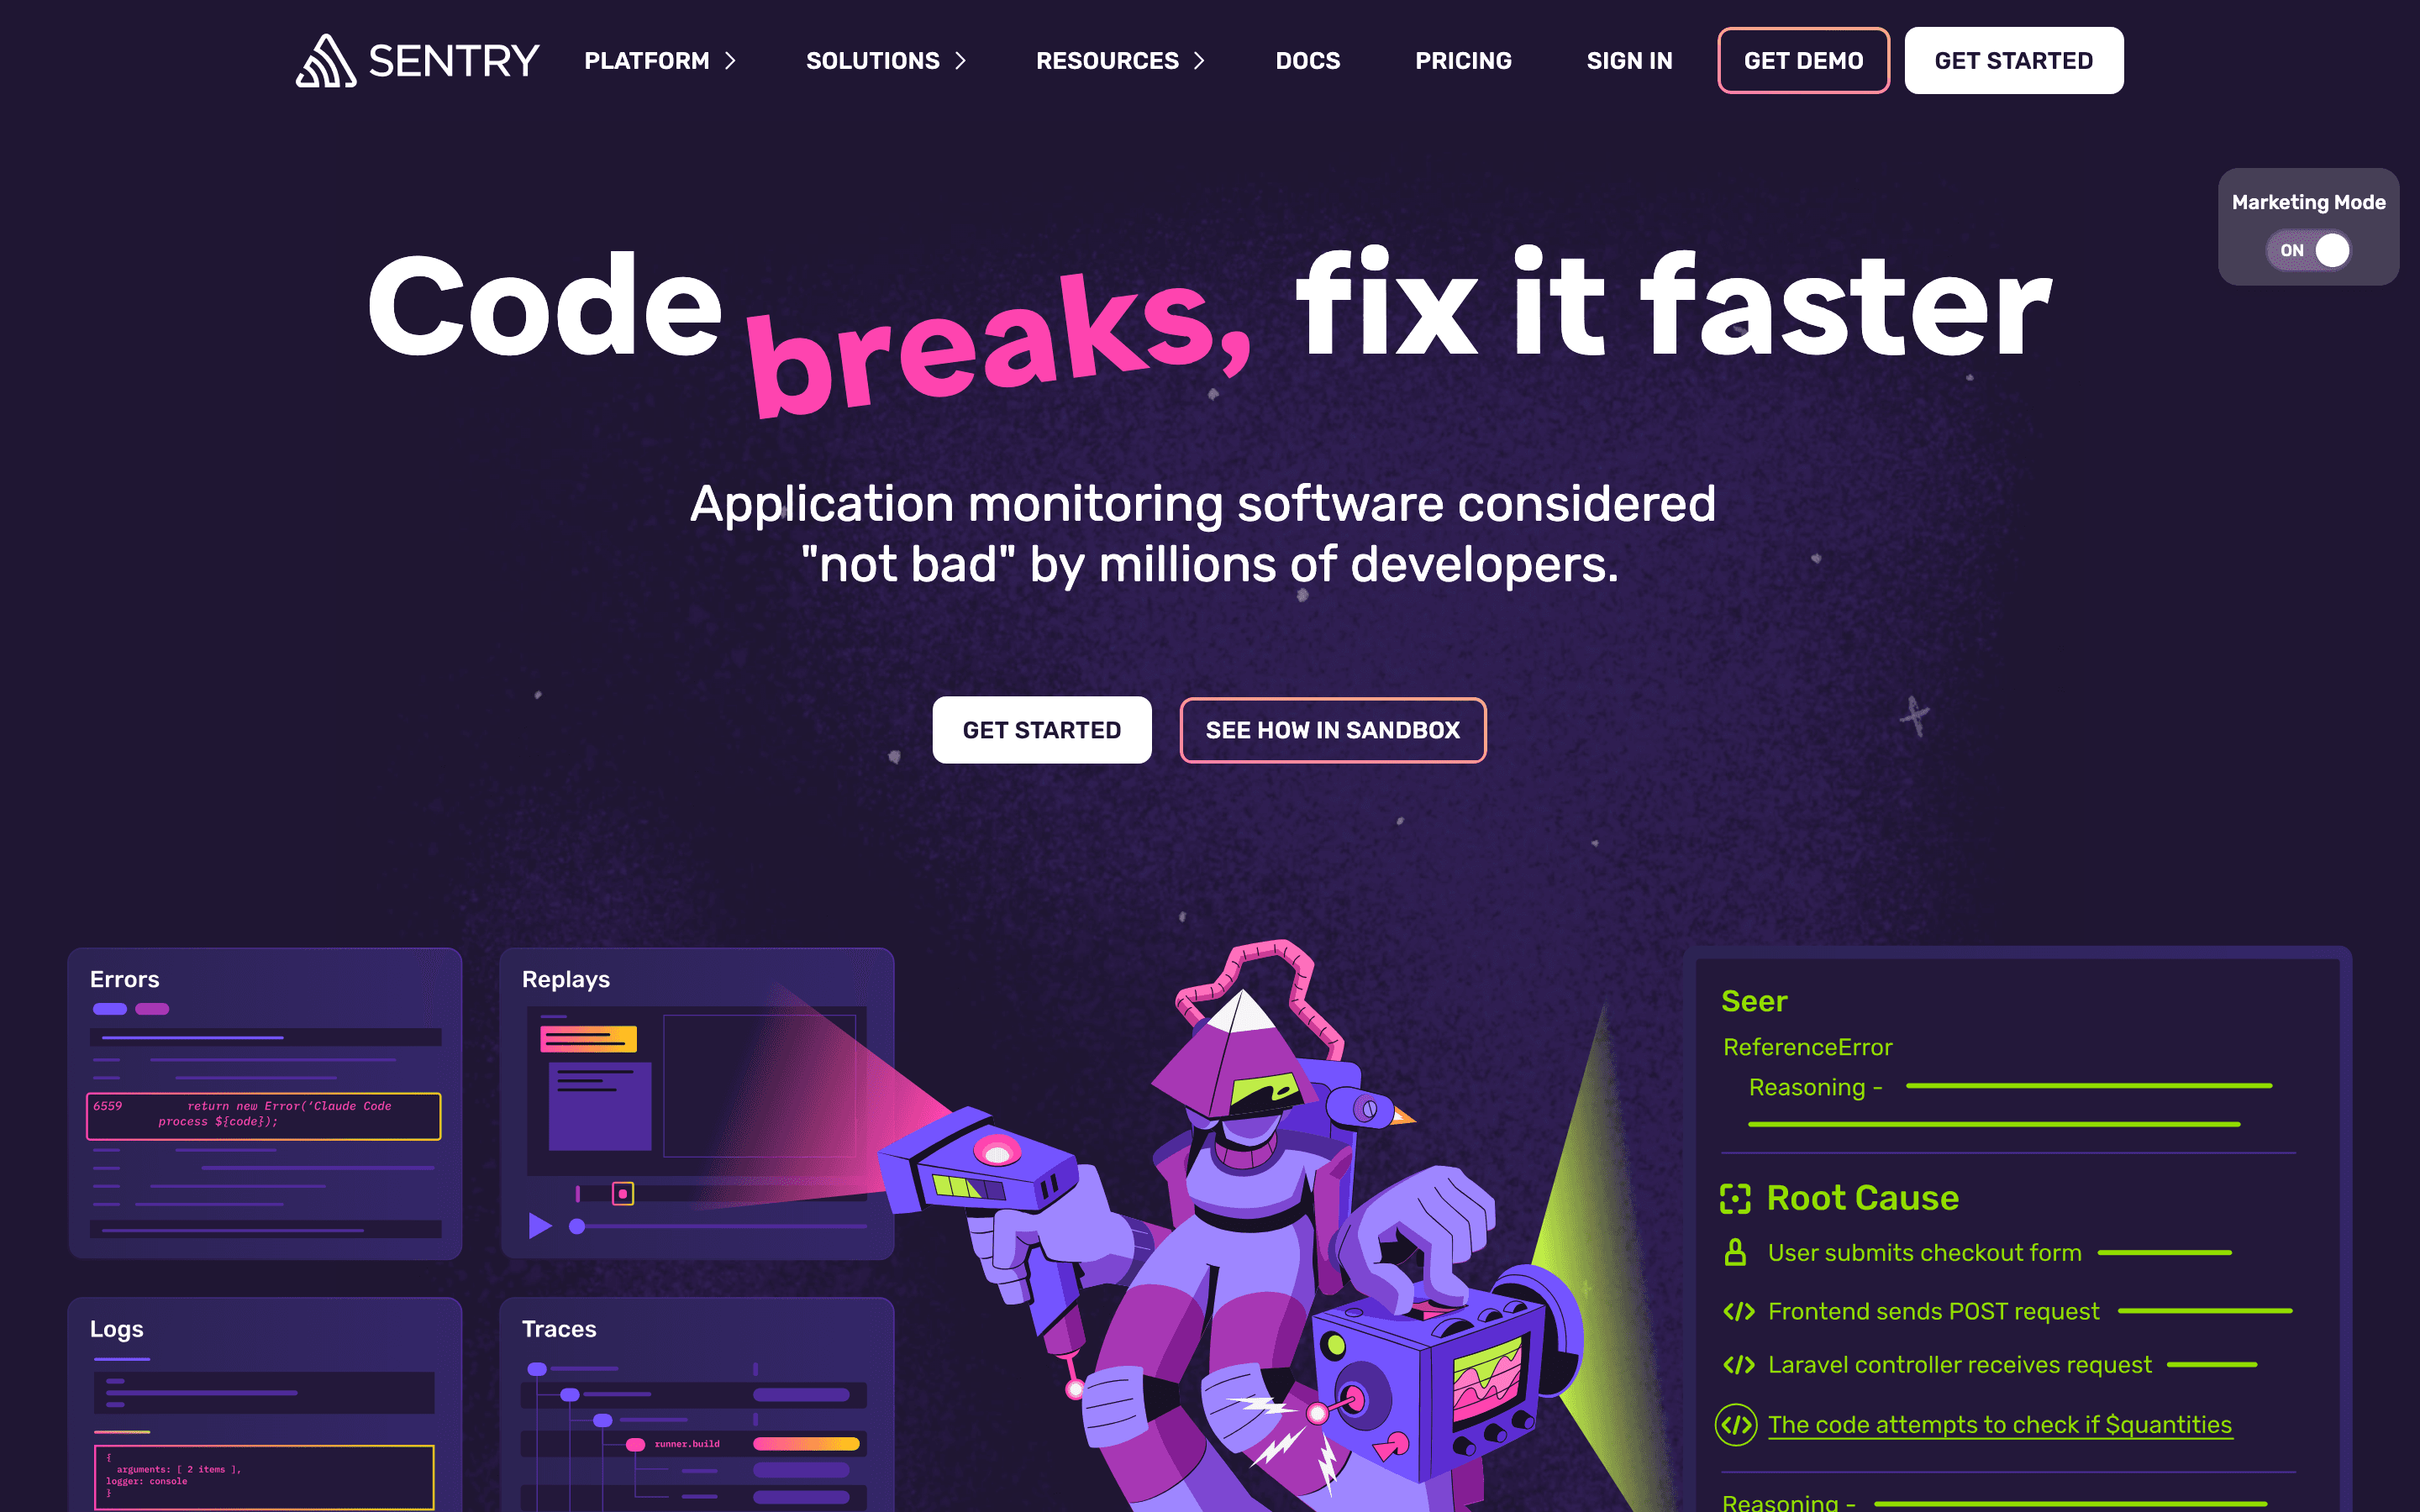
Sentry is the lightest alternative on this list: it covers error tracking, APM, tracing, logs, and session replay, but not infrastructure or host monitoring, so it fits teams whose real complaint about Datadog was paying for infra monitoring they barely used. Pricing is built around event volume with unlimited seats on every paid tier, so adding engineers never adds to the bill the way Datadog's per-host model can. The free Developer plan covers a real 5k errors and 5M spans a month for a solo project. The tradeoff is the same shape as Datadog's: usage-based billing means a bad deploy or a retry loop can spike your event count and your bill in a single day, and Business-tier overage rates run roughly double Team-tier rates at the same volume. Teams that need infra dashboards alongside error tracking will still need a second tool.
Pros
- + Free Developer plan covers a real amount of usage (5k errors, 5M spans) for solo projects, not just a token trial
- + Every tier's data quota and every overage rate is published on the pricing page, so you can model cost before committing
- + Unlimited users on paid plans means adding teammates doesn't raise the bill
Cons
- – Usage-based billing means a bad deploy or a retry loop can spike your bill in a single day: one documented case put error overages alone at roughly $5,700/month plus $1,560 in span overages on top of the $80 Business base, at 20M errors and 500M spans a month
- – Business-tier overage rates for errors and spans run about double the Team-tier rate at the same volume (e.g. $0.0003 vs $0.00015 per error at the highest usage tier); replay overage is priced the same on both plans
Should your product be on this observability & error monitoring list?
If you build a tool that belongs next to the ones above, submit it. A human reviews every submission. Approved products get their own page with pricing and screenshots, plus a place in the comparisons where they fit. It is free. You sign in with your work email so you can follow the decision, and there is no password to create.
Datadog alternatives: FAQ
What is the best Datadog alternative for full-stack observability?+
New Relic is the closest match. It covers infrastructure, APM, logs, and distributed tracing in one platform with a free tier of 100 GB of ingest a month, though giving every engineer full incident-response access costs $99 to $418.80 a seat per month.
Is there a free Datadog alternative?+
Several. New Relic's free plan includes 100 GB of ingest a month, Grafana Cloud's free tier includes 10k metric series and 50 GB each of logs, traces, and profiles, and Honeycomb's free plan covers 20M events a month. All are usable for real small projects, not just short trials.
Which Datadog alternative avoids surprise billing from autoscaling or high cardinality?+
None fully avoid usage-based billing, since most alternatives price on a similar kind of meter Datadog does. Honeycomb, Axiom, and Sentry all price by event or ingest volume instead of host count, which sidesteps Datadog's host high-water-mark calculation and per-tag custom metric billing specifically, though their own volume-based meters can still spike during an incident.
Can I replace Datadog with an open source stack?+
Yes. Grafana, backed by self-hosted Loki for logs, Tempo for traces, and Mimir for metrics, can run entirely on your own infrastructure instead of paying Datadog's per-host and per-GB fees. You take on the operational work Datadog otherwise handles.
Datadog alternatives: pricing compared
Entry price, billing model, and whether pricing is public. 6 of 6 publish pricing you can check without talking to sales.
| Tool | Starting price | Billing | Free option | Pricing disclosed |
|---|---|---|---|---|
| Datadog | $15/host/mo | usage-based | Yes | Partly public |
| New Relic | $10/seat/mo | tiered | Yes | Partly public |
| Grafana | $19/mo | usage-based | Yes | Partly public |
| Honeycomb | $150/mo | usage-based | Yes | Partly public |
| Axiom | $25/mo | usage-based | Yes | Partly public |
| Sentry | $26/mo | usage-based | Yes | Partly public |
How we made these picks. We compare tools on public pricing, features, and hands-on assessment, then verify every price against the vendor's own page. We never accept payment for rankings. Read the full methodology. Spotted an error? Report it.