Honeycomb Review
Event-based observability built around high-cardinality traces and fast BubbleUp debugging
Is this your product? Claim this page · Request a change
Looking for a Honeycomb alternative? See our ranked comparison.→What is Honeycomb?
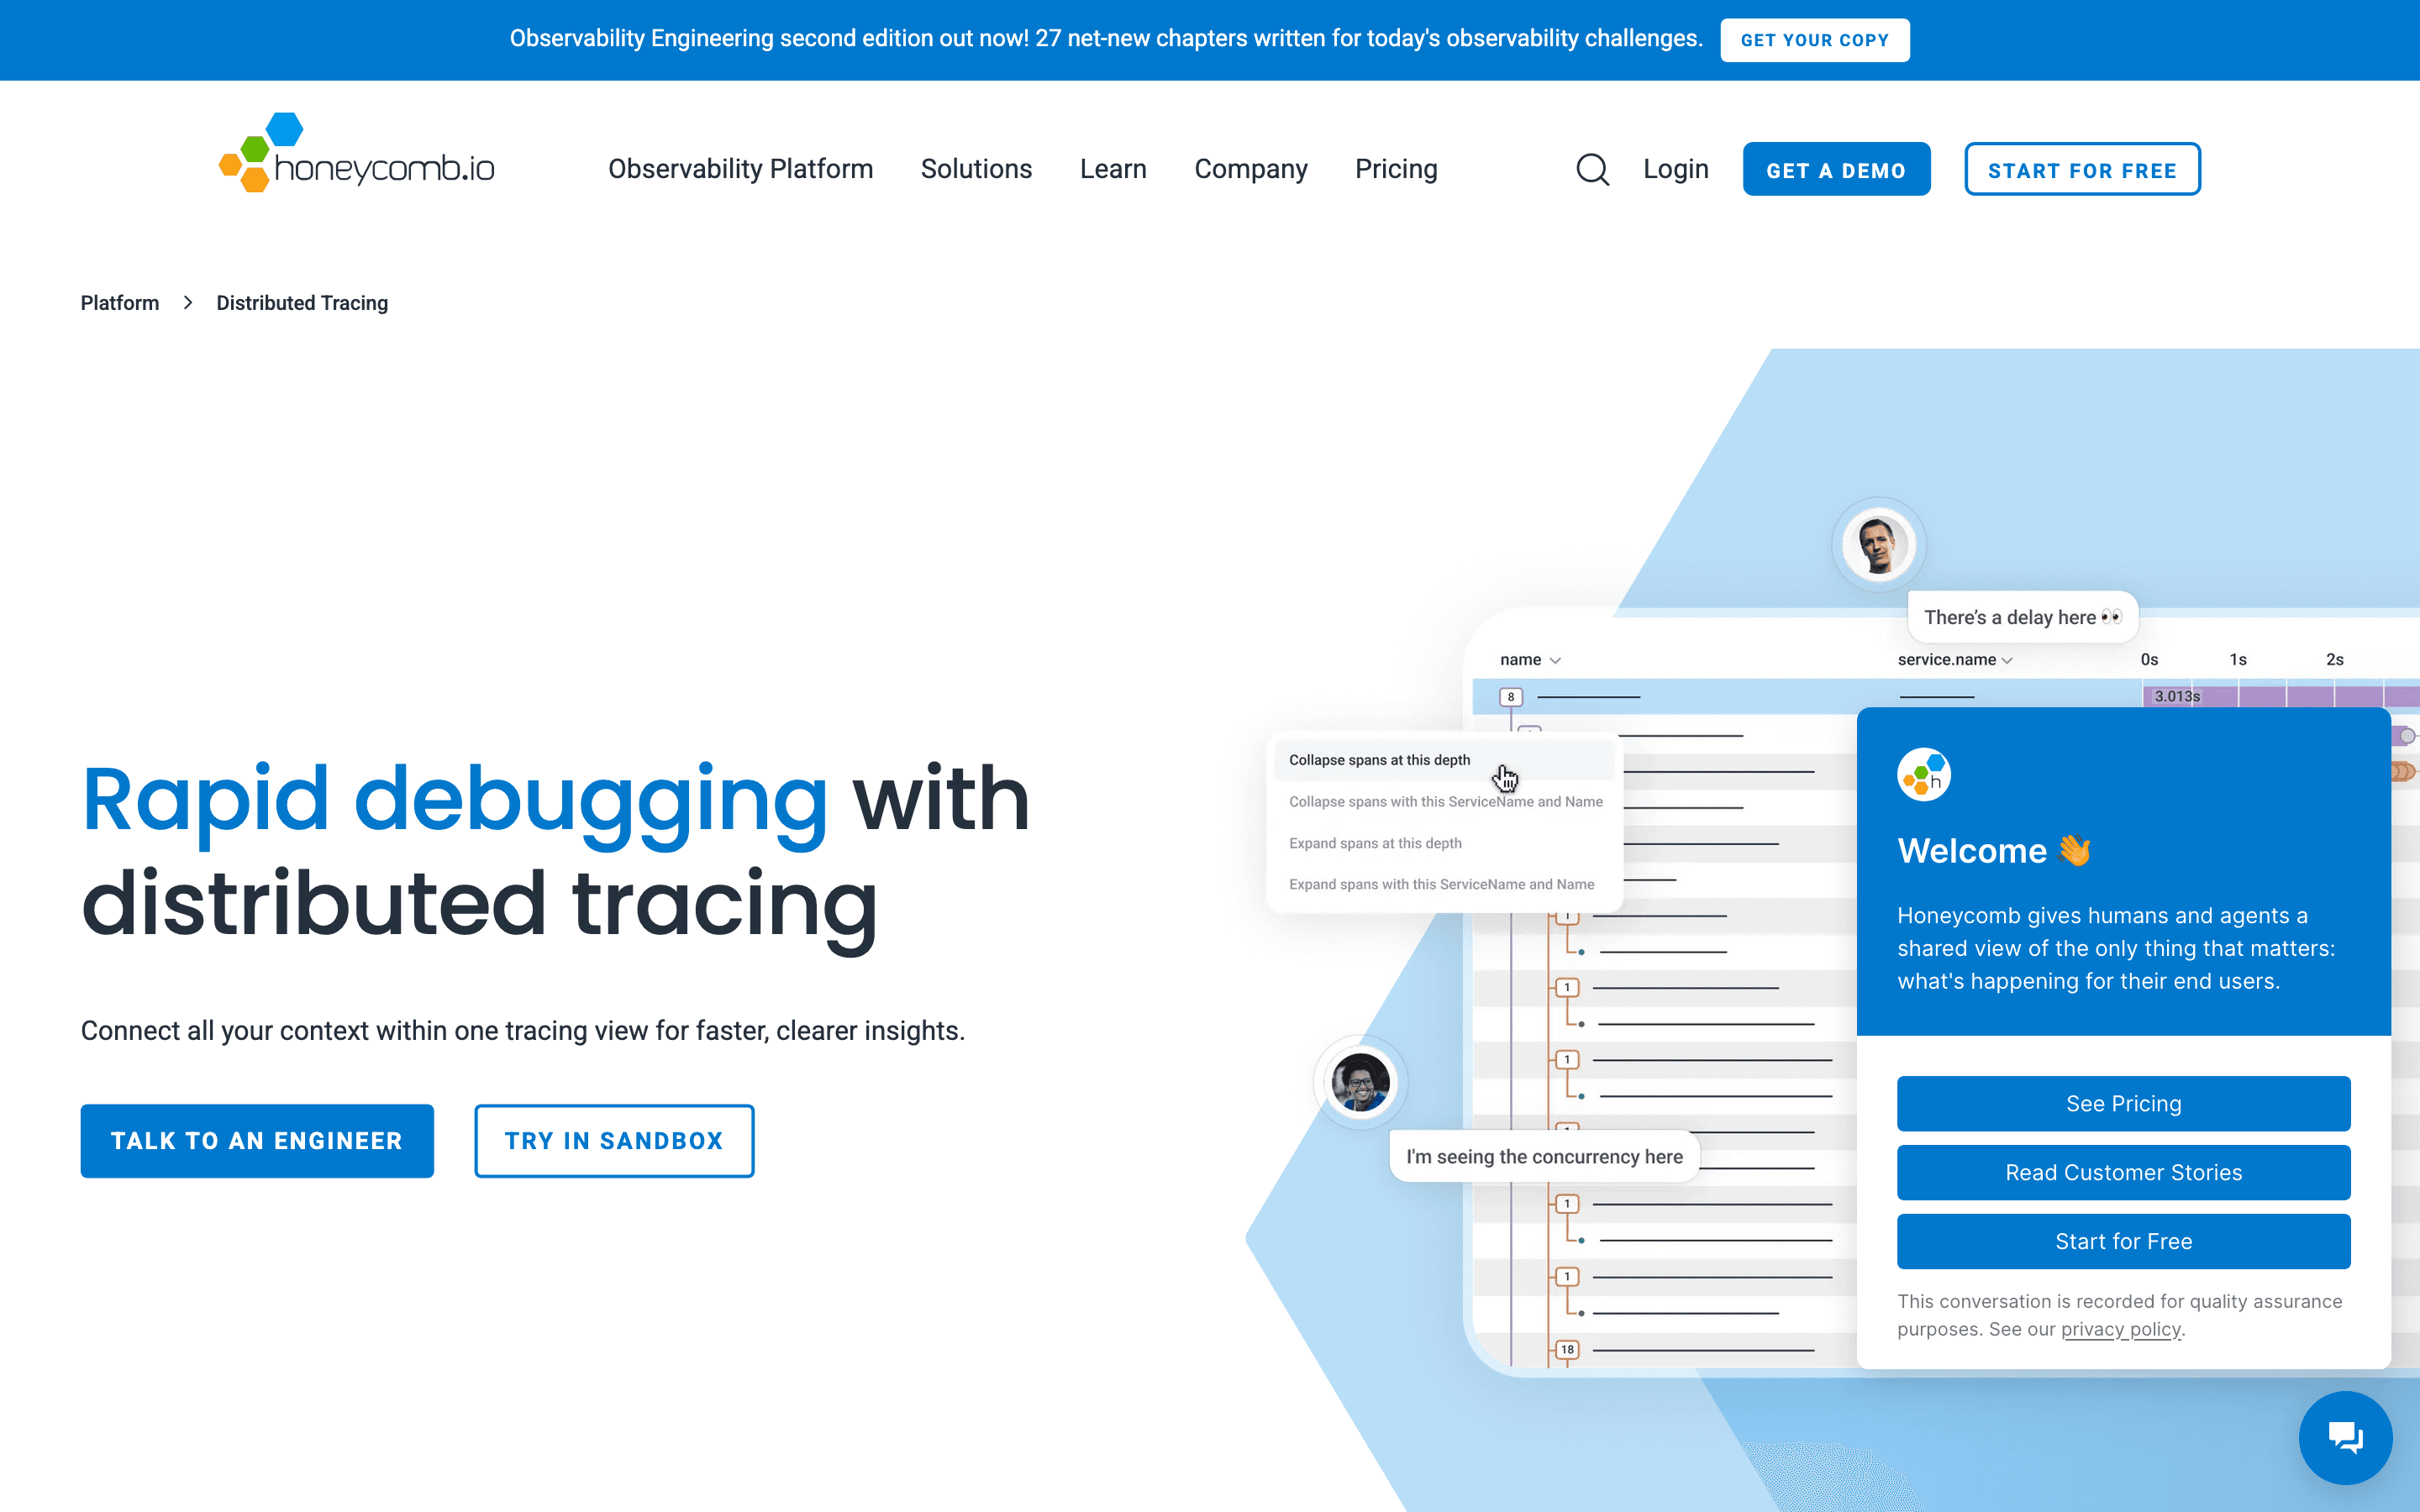
Honeycomb is an observability platform built around wide, high-cardinality events rather than pre-aggregated metrics. You send it structured events (traces, logs, whatever you instrument), and it lets you slice them on any field on the fly, which is the point if your bugs live in the intersection of user ID, region, and build version rather than in a CPU graph.
Its signature feature is BubbleUp: you draw a box around an anomaly in a graph and it automatically surfaces which dimensions are different in that group versus the rest of your traffic. Pricing is per event ingested, not per host or seat, so cost tracks how much you instrument rather than headcount.
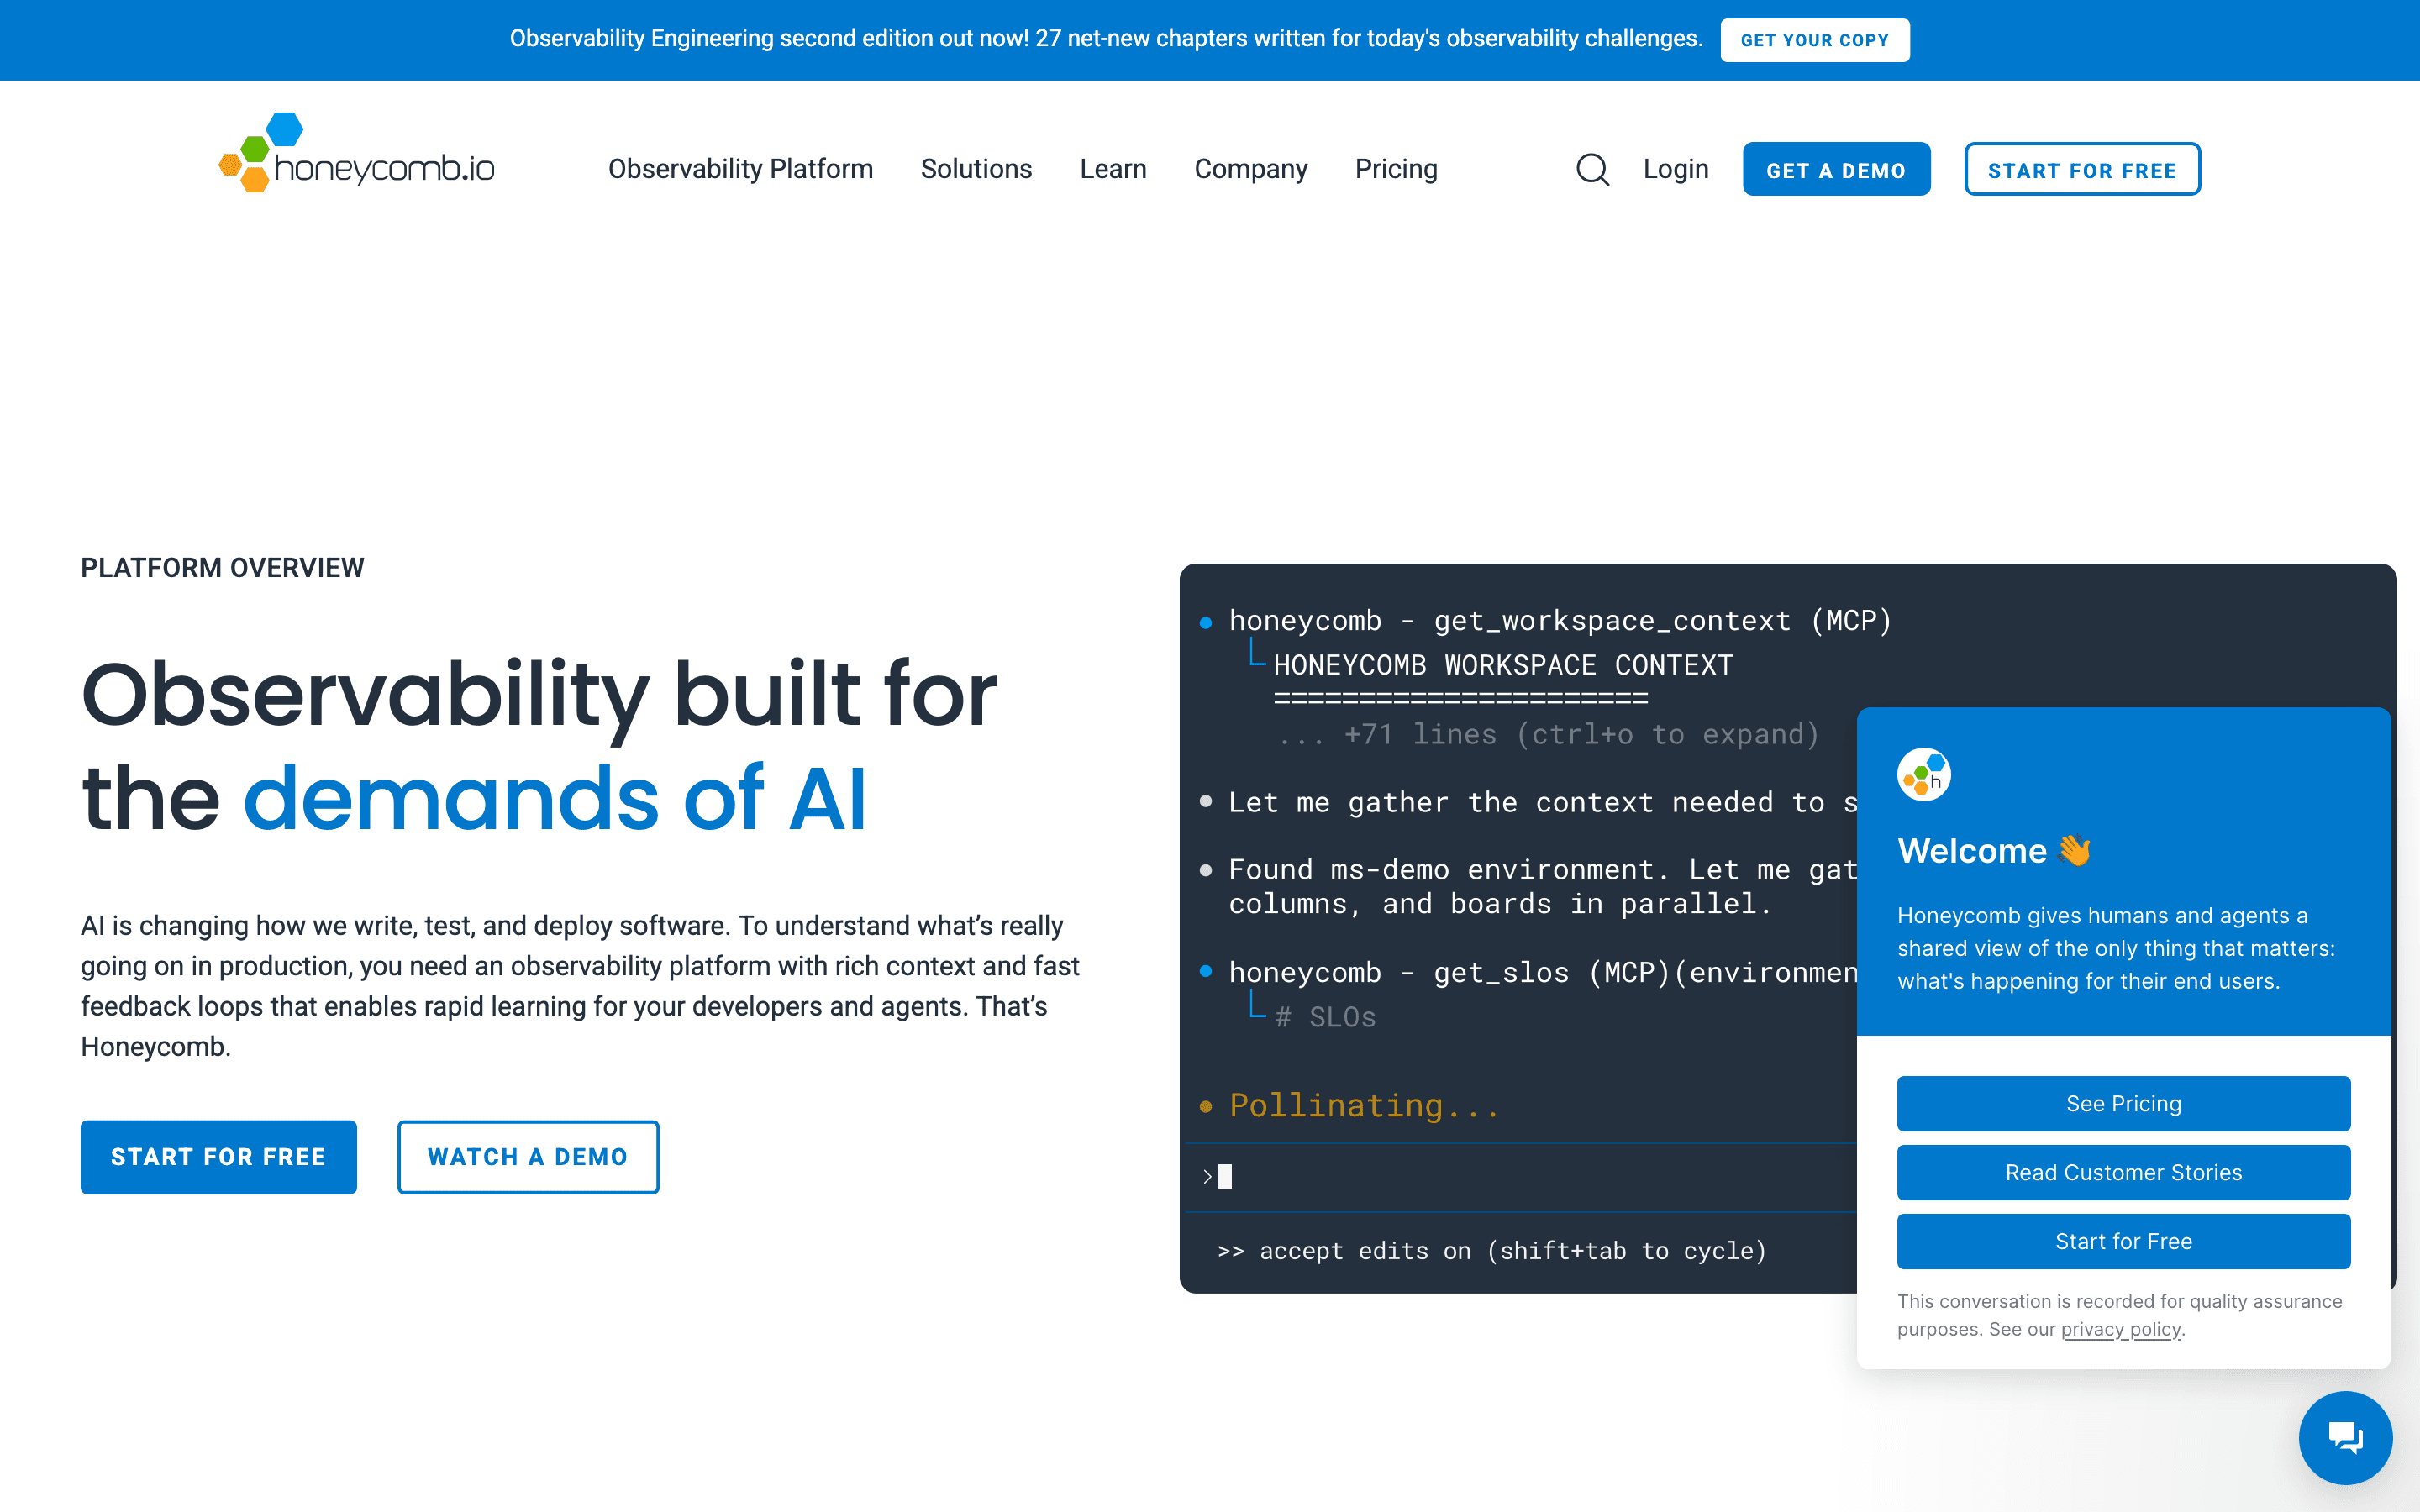
Honeycomb has been pushing further into AI-assisted debugging (a Canvas AI copilot, an MCP server, and a new Agent Timeline view for tracing LLM agent runs), on top of its existing tracing, SLOs, and metrics products.
Honeycomb screenshots
Who it's for
- ✓ Teams debugging production issues that need to slice traces by arbitrary high-cardinality fields (user, request ID, feature flag) instead of a fixed dashboard
- ✓ Engineering orgs already on OpenTelemetry who want a query experience built for that data model
- ✓ Teams instrumenting AI agents and wanting trace-level visibility into agent runs
Who should look elsewhere
- ✗ Teams that want a flat per-host or per-seat bill they can forecast without watching event volume
- ✗ Small teams that mainly need uptime/infra dashboards and don't need per-request tracing
- ✗ Orgs that need a single tool covering logs, metrics, traces, and infra monitoring out of the box without separate tooling
Pros
- + BubbleUp finds the differentiating dimensions of an anomaly automatically instead of making you guess which graph to check next
- + Query latency stays fast even on very high-cardinality fields, which is the specific weakness of most metrics-first tools
- + Free tier is genuinely usable for small projects at 20M events and 100M metrics points a month
- + Seats and querying are unlimited on every paid tier, so adding engineers doesn't add to the bill
Cons
- – Bill scales with event volume, so a spike in trace volume or an unsampled deploy can jump your usage without any seat or infra change
- – Enterprise pricing is quote-only, so budgeting past Pro's ~750M events/month requires a sales conversation
- – No built-in infra/host monitoring the way an APM-plus-infra suite offers, so teams often still run a separate tool for that
- – Sampling strategy has to be set up deliberately or costs creep as instrumentation grows
Honeycomb pricing
At about $150/month to start, it sits at the higher end of Observability & Error Monitoring pricing.
| Plan | Price | Highlights |
|---|---|---|
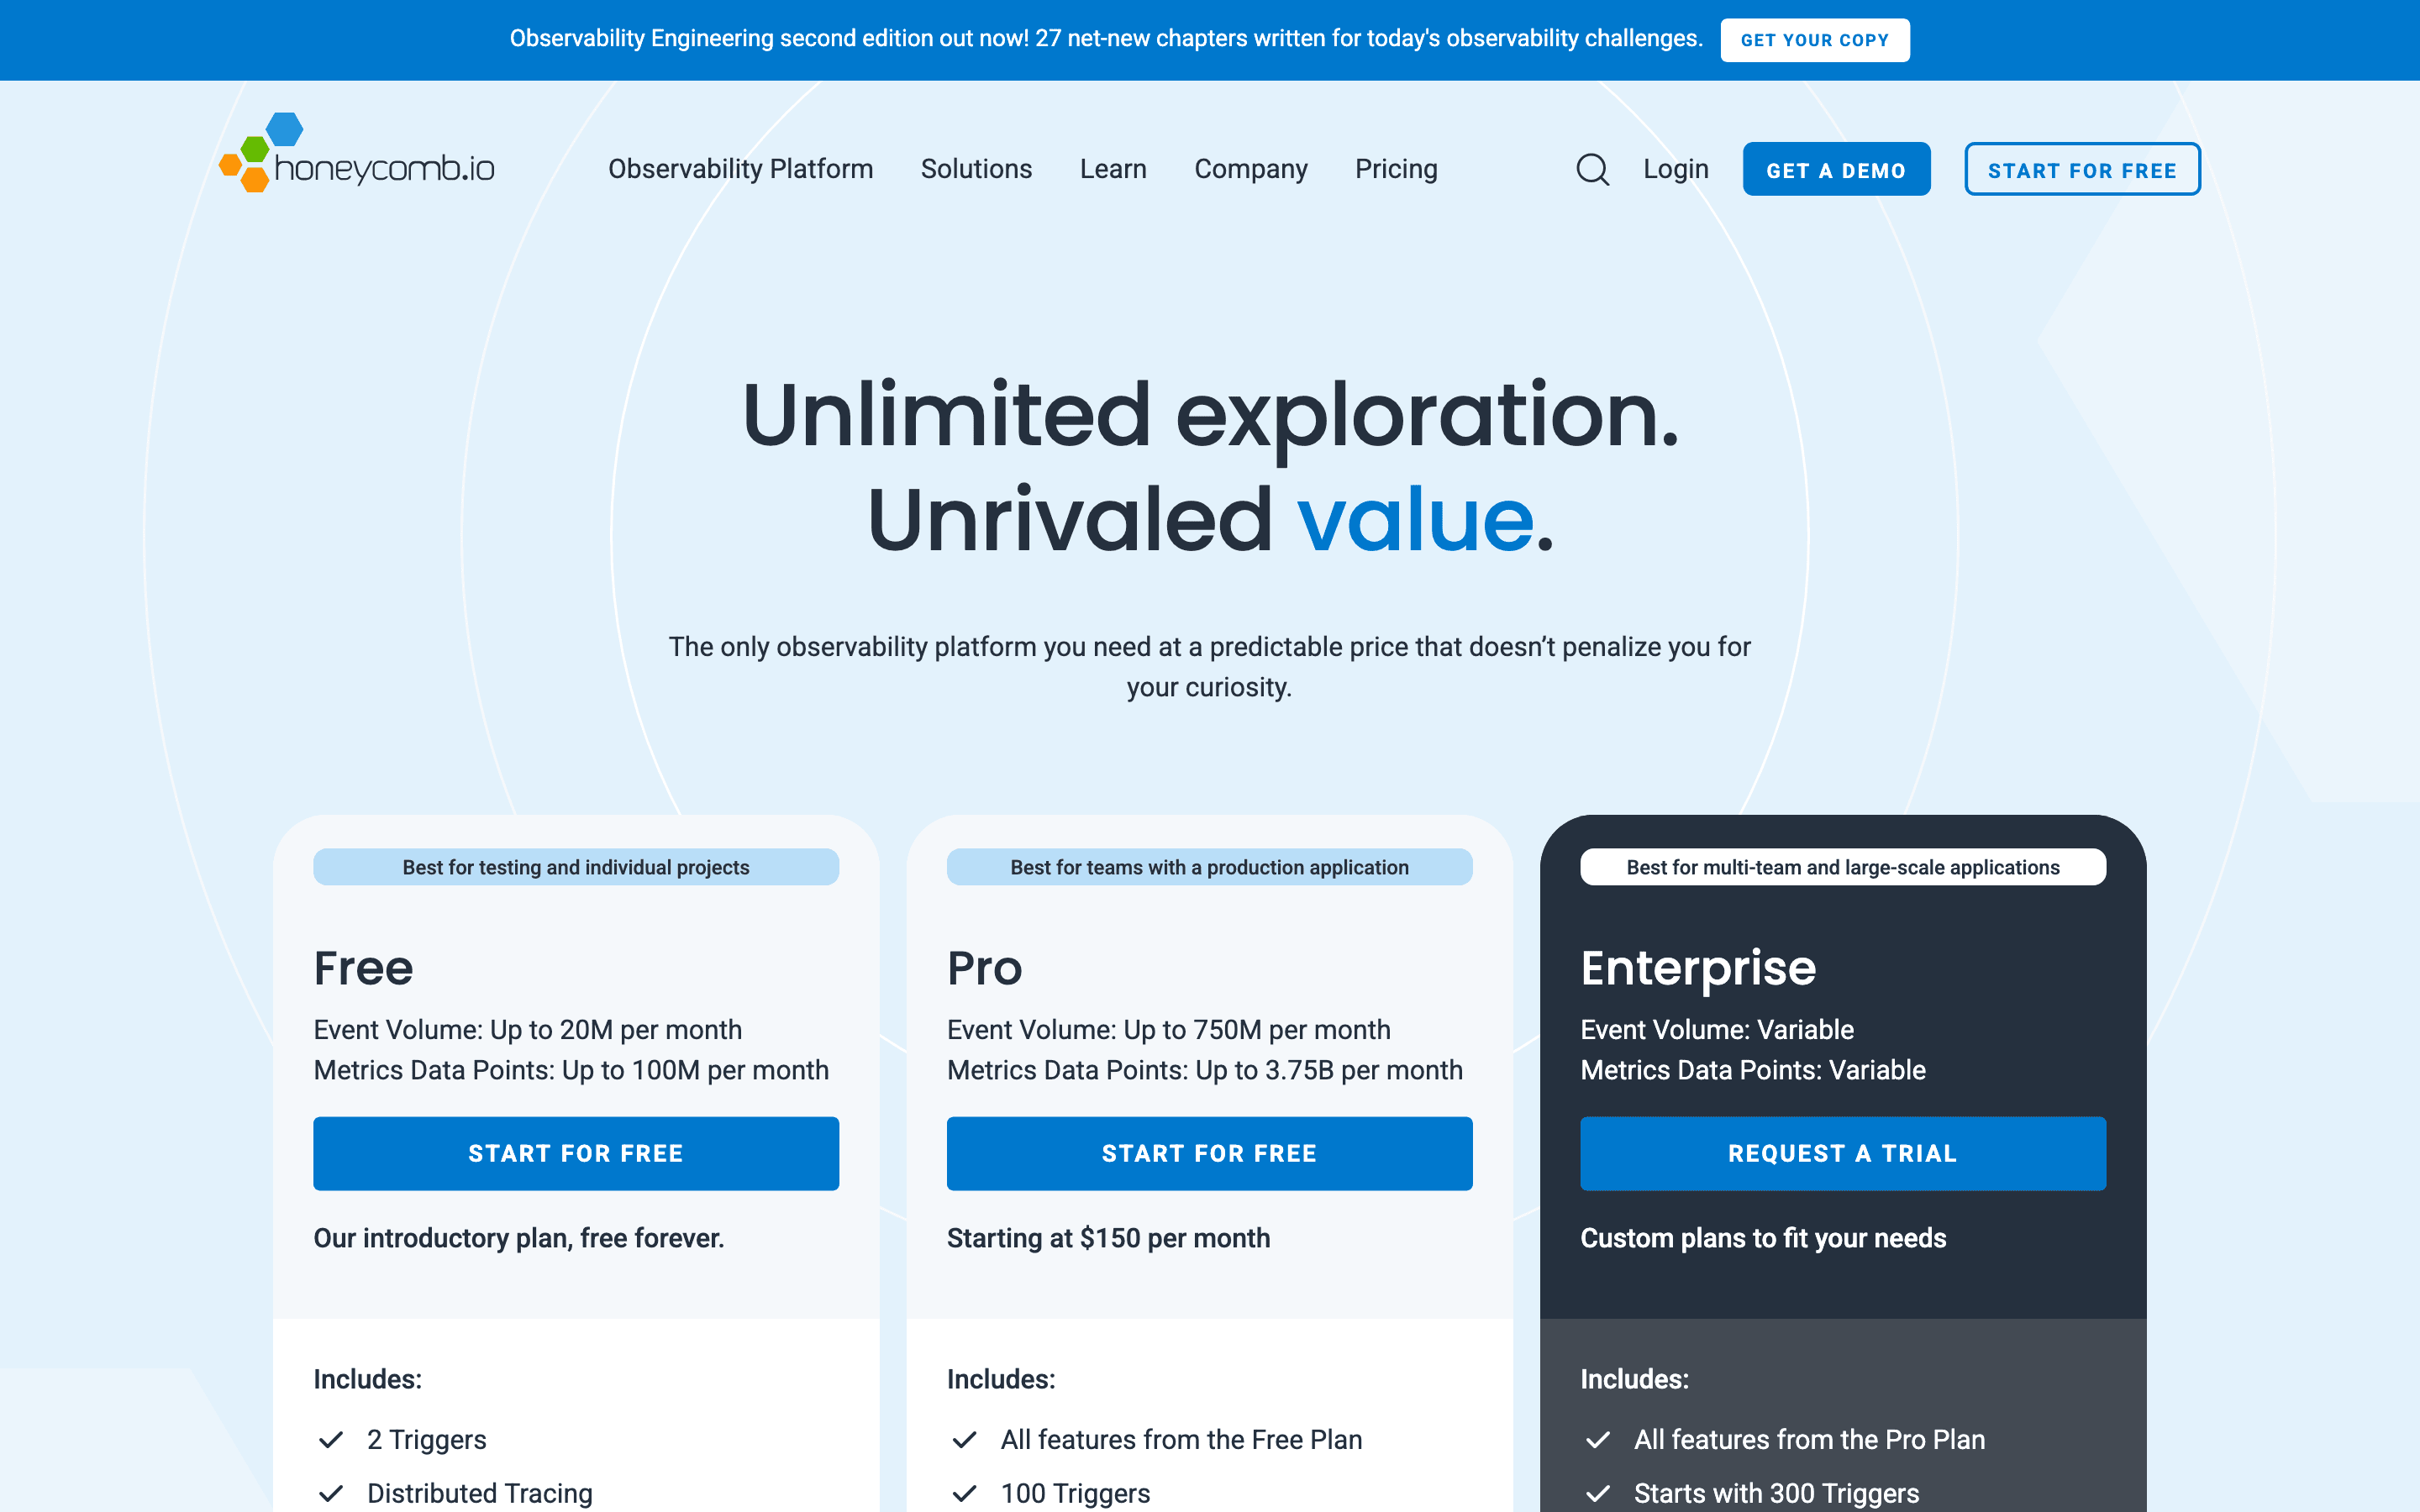
| Free | Free | Up to 20M events/month · Up to 100M metrics data points/month · 2 triggers · Distributed tracing, BubbleUp, OpenTelemetry support |
| Pro | $150/mo | Up to 750M events/month · Up to 3.75B metrics data points/month · 100 triggers, 2 SLOs, SSO · Vendor support included |
| Enterprise | Custom | Starts with a 10B events/year base allowance · 300+ triggers, 100+ SLOs · Service Map, Query Data API, AWS PrivateLink · Private cloud option |
Pricing is based on ingested events per month, not seats or hosts; seats and querying are unlimited on every tier. Pro is self-serve, starting at $150/month for its base event allotment and scaling up as you buy more volume. Enterprise starts with a 10B-events/year base allowance and is otherwise quote-only (request-a-trial only, no public self-serve signup). A separate Telemetry Pipeline (OpenTelemetry collector) add-on is billed starting at $0.10/GB. Unused monthly events and metrics data points do not roll over; the counter resets on the 1st of each month regardless of billing date. No public free-trial length is stated for paid plans.
Pricing verified July 7, 2026 · source
How Honeycomb's pricing compares
Honeycomb next to its closest alternatives on entry price, billing, and whether pricing is public.
| Tool | Starting price | Billing | Free option | Pricing disclosed |
|---|---|---|---|---|
| Honeycomb | $150/mo | usage-based | Yes | Partly public |
| Sentry | $26/mo | usage-based | Yes | Partly public |
| Datadog | $15/host/mo | usage-based | Yes | Partly public |
| New Relic | $10/seat/mo | tiered | Yes | Partly public |
| Grafana | $19/mo | usage-based | Yes | Partly public |
| Axiom | $25/mo | usage-based | Yes | Partly public |
Is Honeycomb still actively developed?
Last significant update: June 2026. Agent Timeline, a unified view for tracing LLM behavior and multi-agent workflows across prompts, tool calls, and failures, reached general availability.
Top Honeycomb alternatives
Honeycomb FAQ
Is Honeycomb free?+
Yes. The Free plan covers up to 20M events and 100M metrics data points a month with unlimited seats, distributed tracing, and BubbleUp.
How does Honeycomb pricing work?+
You pay based on events ingested per month, not per seat or per host. Pro starts at $150/month for its base event allotment and scales up with volume; Enterprise starts with a 10B events/year base allowance and is otherwise custom-priced.
Can Honeycomb costs spike unexpectedly?+
Yes. Because pricing tracks ingested event volume, an unsampled trace burst or new high-cardinality instrumentation can raise your bill without any change in seats or hosts, which is a common complaint in reviews.