Top Grafana Alternatives in 2026
Here for Grafana itself? See the full Grafana profile, pricing & reviews →
Suggest a change- If you want one vendor to replace a self-hosted Grafana, Prometheus, Loki, and Tempo stack and have the budget and headcount to manage it, choose Datadog. it bundles infra, APM, logs, and security into one query language and one set of dashboards, backed by over 1,000 integrations, so you stop maintaining four separate open-source projects yourself.
- If your hardest debugging problems live in high-cardinality fields like user ID, region, or build version rather than a fixed set of graphs, choose Honeycomb. BubbleUp automatically finds which dimension explains an anomaly, and pricing runs on event volume rather than the cardinality that inflates Grafana Cloud's metrics bill.
- If the real problem with Grafana Cloud is tracking seven separately metered dimensions and you just want one number to budget against, choose Axiom. it charges a single $25/month platform fee plus metered credits for ingest and query compute, with no per-seat charge and automatic volume discounts instead of a sales negotiation.
- If you want one platform for APM, infra, and logs but your team is small enough to live inside a free data allowance with a single full-access engineer, choose New Relic. its Free plan includes 100 GB of data ingest and one full platform user forever, a simpler shape to reason about than Grafana Cloud's separate metrics, logs, and traces quotas.
- If most of what pages you at 2am is an application exception or a slow transaction, not a saturated host, choose Sentry. it ties every error straight back to the release and commit that caused it, and its Seer AI agent can propose a fix automatically, which none of the infra-first tools here do.
- If you already run Prometheus, Loki, or Tempo yourself and just want a dashboard and alerting layer on top, or self-hosting for free is a hard requirement, choose stay on Grafana. no tool here matches its combination of a genuinely free, self-hostable open-source core and wide support for data sources you already run, so paying a new vendor would replace something that already works.
Grafana got you dashboards for free and still gets grief for its bill once you move to Grafana Cloud. Metrics pricing tracks cardinality, not volume, so a new Kubernetes cluster or an extra label on a metric can jump your bill several times over, and the total is split across seven-plus separately metered products: metrics, logs, traces, profiles, k6, synthetics, and active users.
The five tools below cover the situations that actually drive people to look elsewhere: a one-vendor replacement for the whole self-hosted stack, a tracing tool built for high-cardinality debugging, a simpler usage-based bill, a bundled platform priced by seat instead of cardinality, and a narrower tool for teams whose real problem is application errors, not infra dashboards.
Grafana alternatives compared
| Tool | Best for | Starting price | Free option | Last update |
|---|---|---|---|---|
| DatadogBest all-in-one replacement | Teams that want one platform for infra, APM, and logs instead of stitching together open source tools | $15/host/mo | Yes | June 2026 |
| HoneycombBest for high-cardinality debugging | Teams debugging production issues that need to slice traces by arbitrary high-cardinality fields (user, request ID, feature flag) instead of a fixed dashboard | $150/mo | Yes | June 2026 |
| AxiomBest value / simplest bill | Teams that want to keep full-fidelity logs and traces at high volume without paying per-host or per-GB-ingested list price | $25/mo | Yes | June 2026 |
| New Relic | Teams that want one platform for APM, infra, logs, and traces instead of running several separate tools | $10/seat/mo | Yes | June 2026 |
| SentryBest for application error tracking | Engineering teams that want error alerts tied directly to the code and release that broke | $26/mo | Yes | July 2026 |
Why teams switch from Grafana
Metrics pricing is driven by cardinality, not raw data volume
Adding a label, or standing up a second Kubernetes cluster, can multiply the number of unique metric series and push you into a much higher bill. A single 50-pod cluster alone can generate over 100,000 series from default Prometheus exporters, roughly $650/month on Pro pricing before any custom metrics are added.
The bill is split across seven or more separately metered dimensions
Metrics, logs, traces, profiles, k6 virtual users, synthetics, and active users each carry their own rate, which makes forecasting one total number hard as usage grows.
You pay for log and trace data whether you ever query it or not
Ingestion is billed the moment data lands, regardless of whether anyone looks at it later, which punishes teams that log defensively rather than sparingly.
Self-hosting to dodge the cloud bill still needs someone to own Prometheus and cardinality
Grafana Labs positions the self-hosted path for platform teams comfortable tuning cardinality and retention manually. Without that person on staff, the free option costs engineering time instead of dollars.
The best Grafana alternatives, ranked
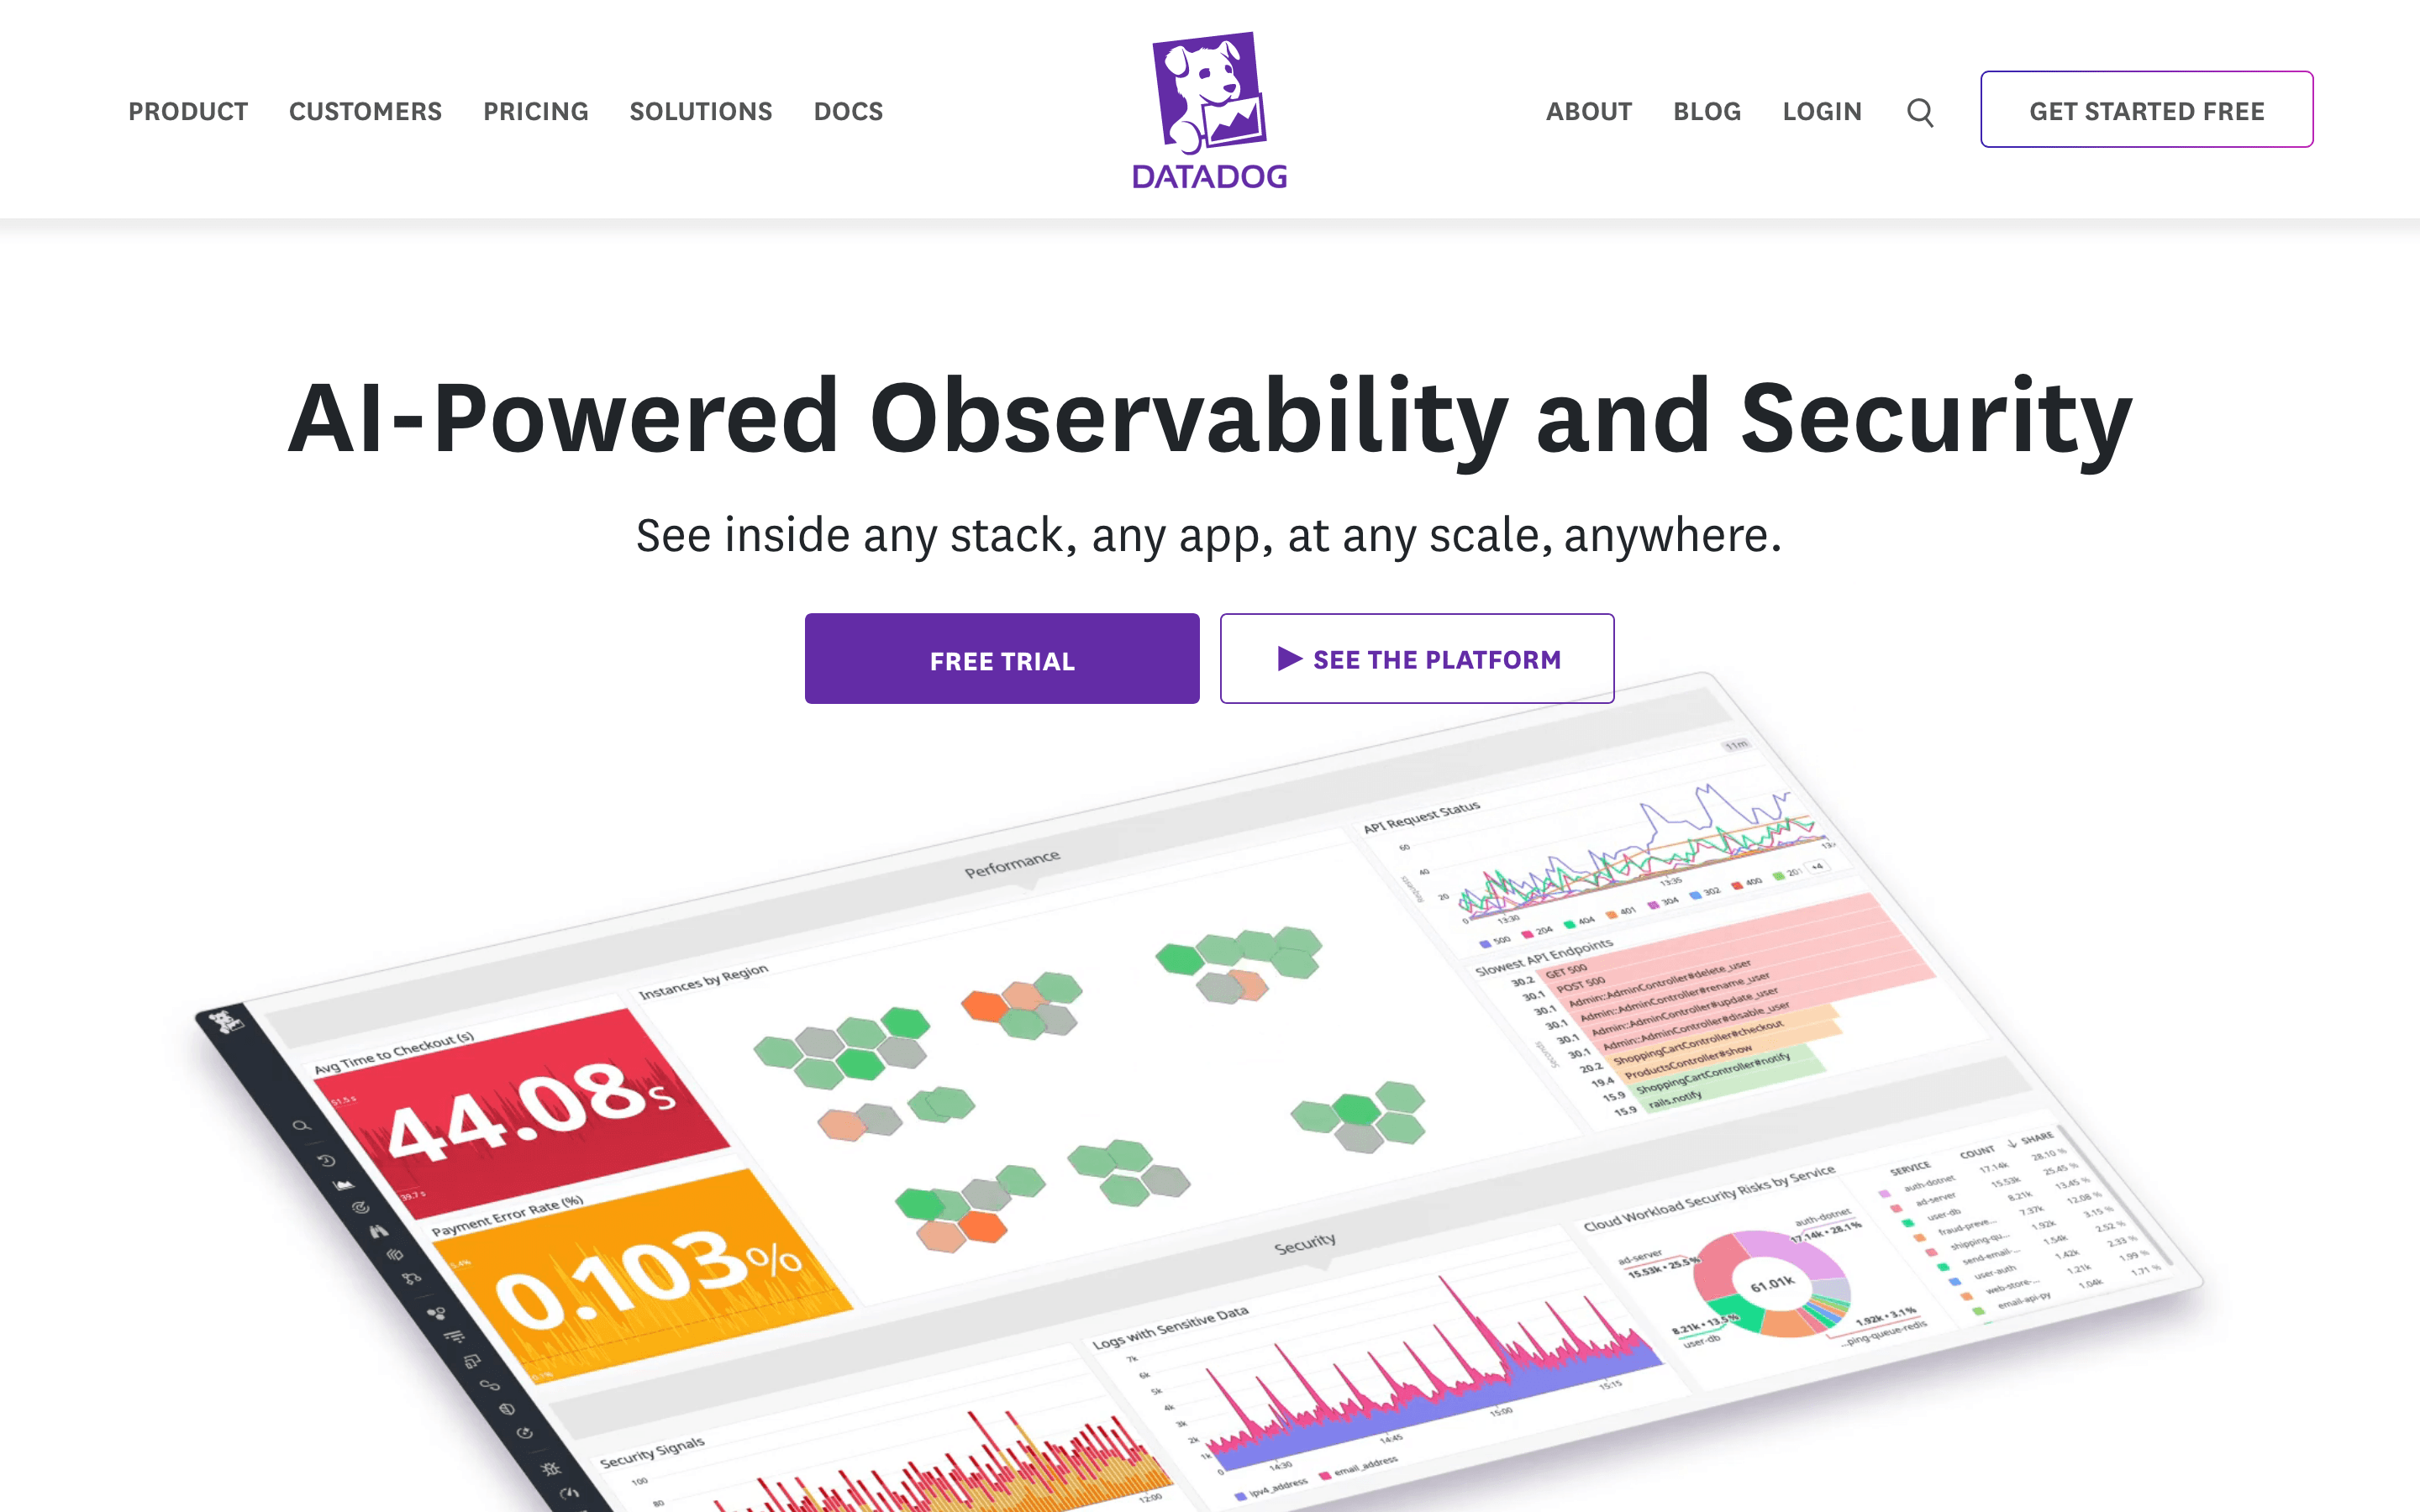
Datadog is the closest thing to a drop-in replacement for a self-hosted Grafana, Prometheus, Loki, and Tempo stack: one agent, one query language, and dashboards that cover infra, APM, logs, RUM, and security without gluing four open-source projects together yourself. It is the market incumbent for observability at scale, with over 1,000 integrations so most AWS, GCP, or Azure services plug in without custom work. The catch is that its pricing looks like Grafana's own cardinality problem in a different shape: infra hosts, APM hosts, log ingestion, log indexing, and custom metrics each bill on their own meter, and host counts use a high-water-mark calculation that can lock in a whole month's charge from a multi-day autoscaling spike. Datadog fits teams with the headcount to actively manage that, not small teams chasing a predictable number.
Pros
- + Covers infra, APM, logs, RUM, and security in one product with shared dashboards and one query language
- + 1,000+ integrations, so most cloud services and tools plug in without custom work
- + Free tier and 14-day trial with no credit card, so you can test it before committing
Cons
- – Pricing is split across many separately metered products (hosts, containers, custom metrics, log ingestion, log indexing), so the real bill is hard to predict from the pricing page alone
- – Host billing excludes only the top 1% of hourly readings each month, so a multi-day autoscaling spike, not just a brief one, can set the whole month's charge at that peak
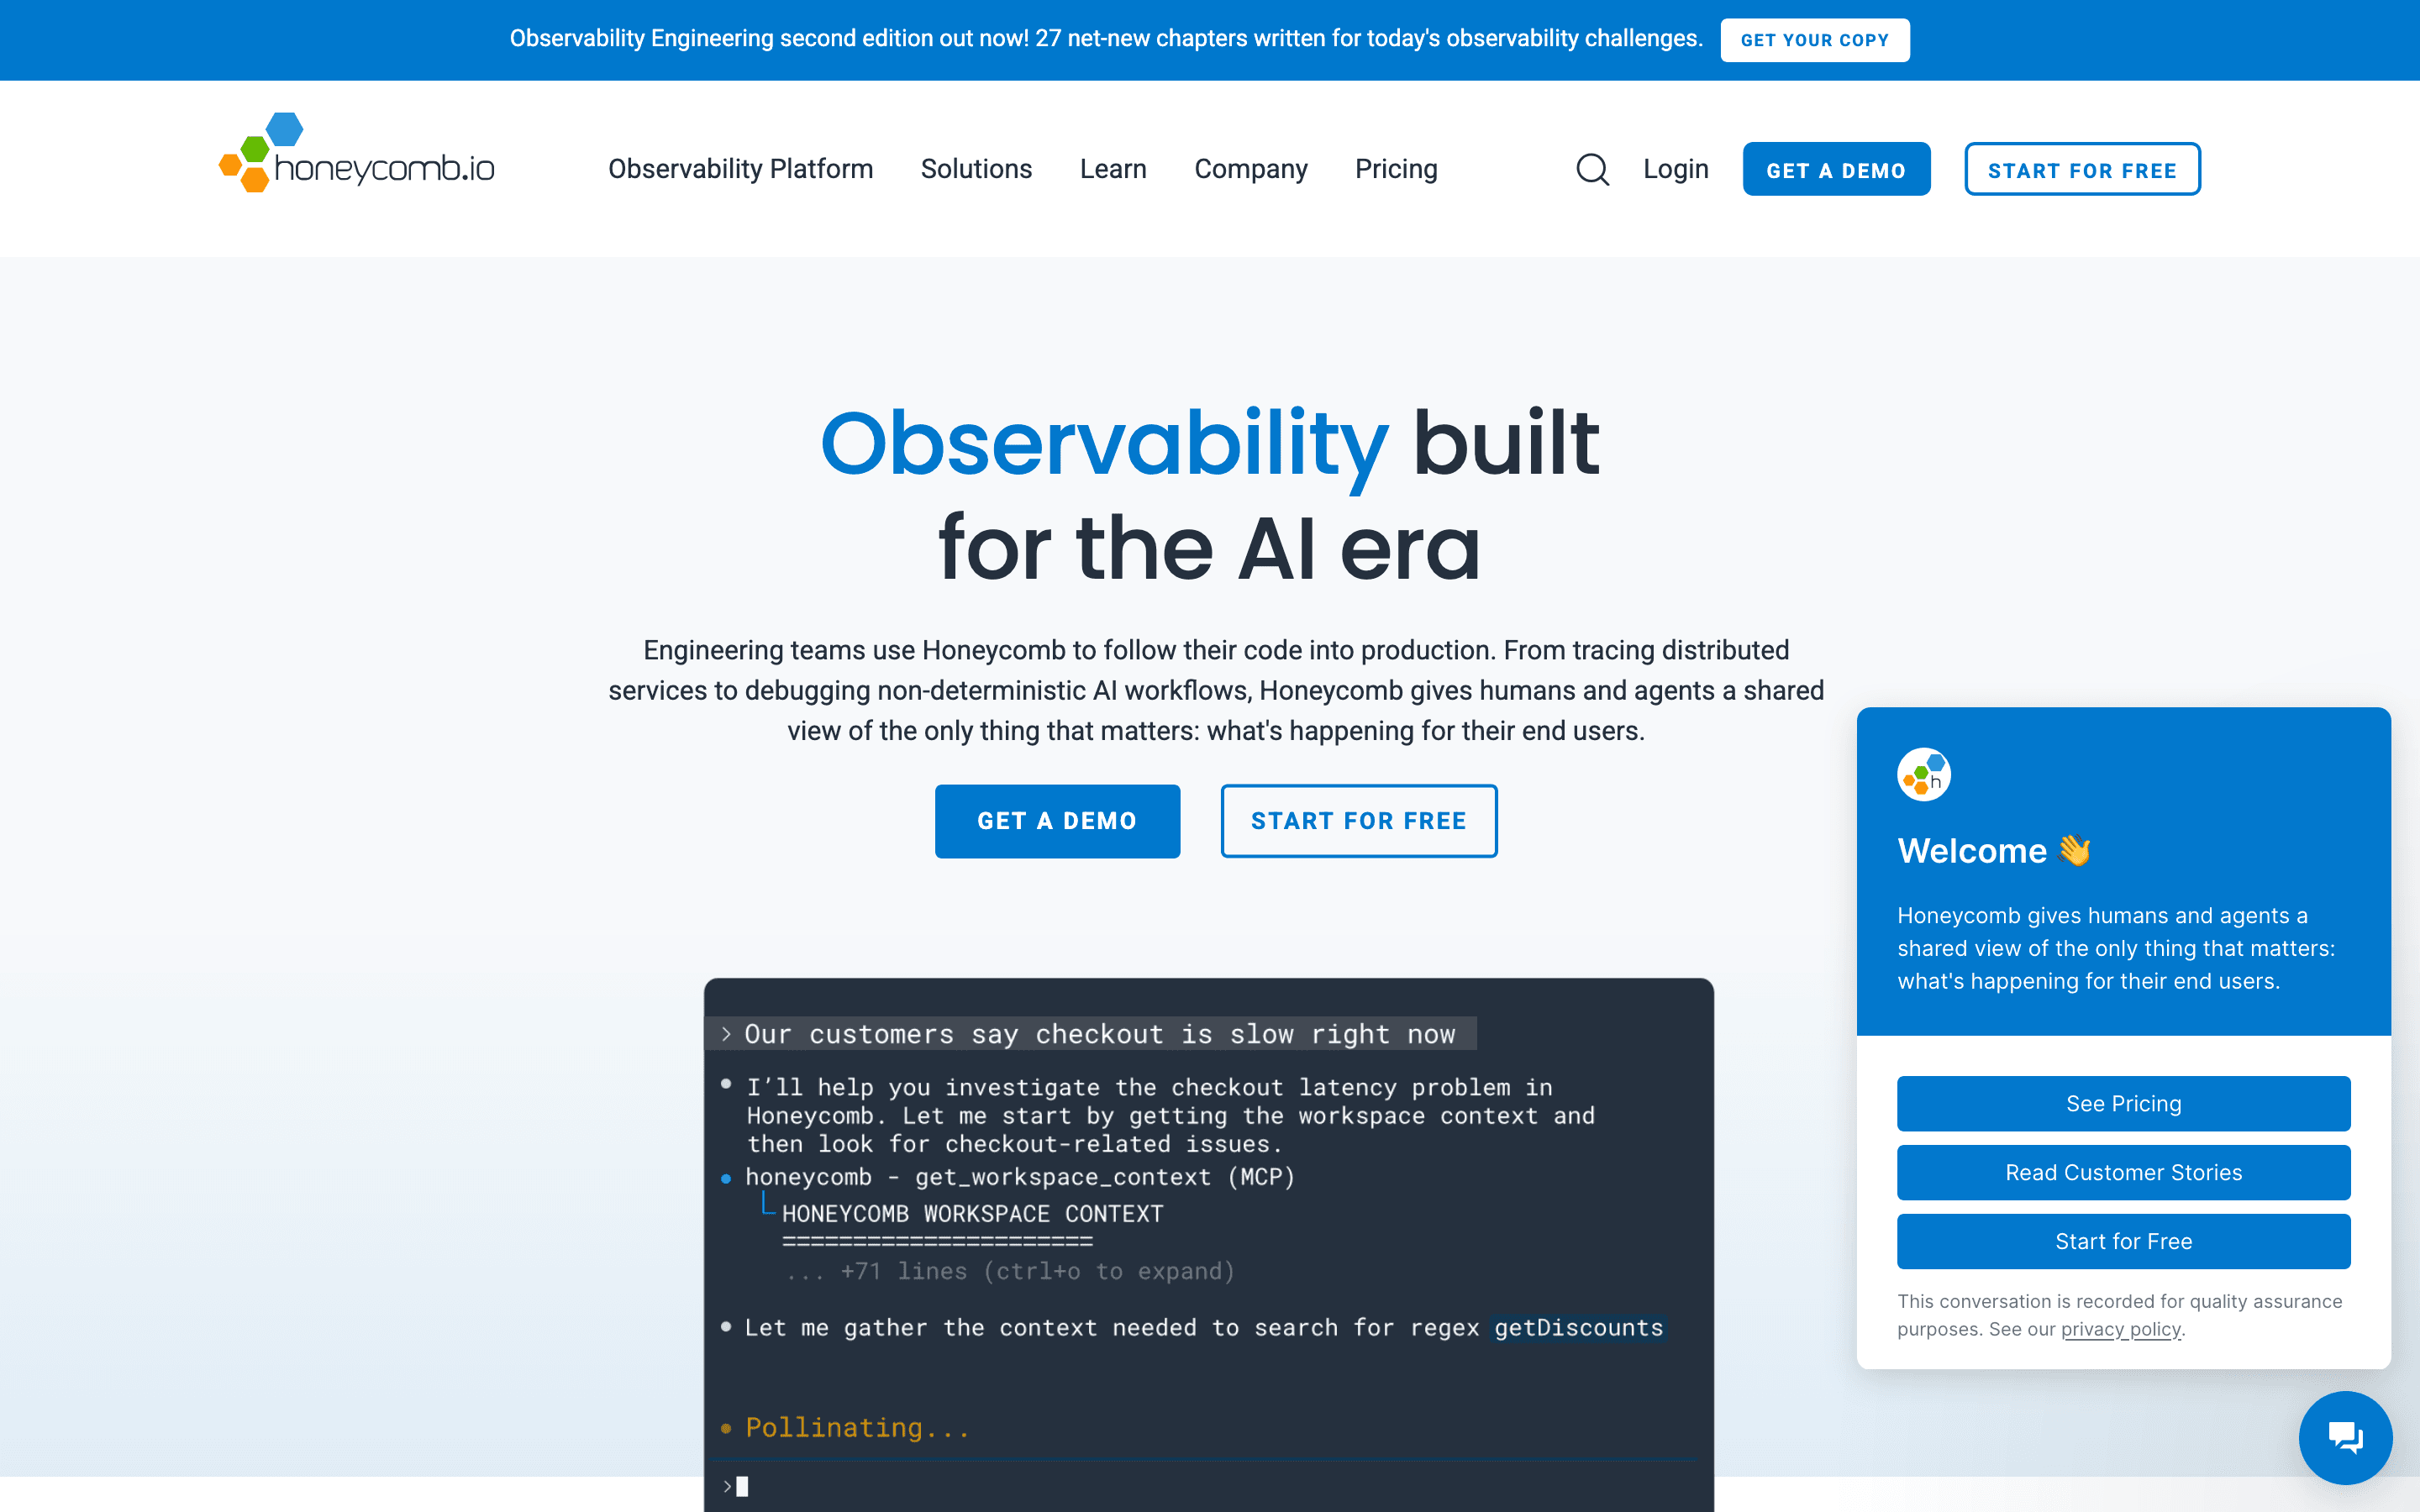
Honeycomb is built for a different failure mode than Grafana's dashboards: instead of watching pre-aggregated graphs, you send wide events and slice them on any field, then let BubbleUp point at the dimension that actually explains the anomaly. That matters if your incidents live in the intersection of user ID, region, and build version rather than a CPU chart. Pricing runs on ingested events, not cardinality, so adding labels or high-cardinality fields to your traces does not multiply your bill the way it can on Grafana Cloud's metrics pricing. Seats and querying are unlimited on every tier, and the free plan covers 20 million events a month. What it does not do is replace Grafana's infra dashboards outright; teams debugging with Honeycomb often still run something else for host-level monitoring.
Pros
- + BubbleUp finds the differentiating dimensions of an anomaly automatically instead of making you guess which graph to check next
- + Query latency stays fast even on very high-cardinality fields, which is the specific weakness of most metrics-first tools
- + Free tier is genuinely usable for small projects at 20M events and 100M metrics points a month
Cons
- – Bill scales with event volume, so a spike in trace volume or an unsampled deploy can jump your usage without any seat or infra change
- – Enterprise pricing is quote-only, so budgeting past Pro's ~750M events/month requires a sales conversation
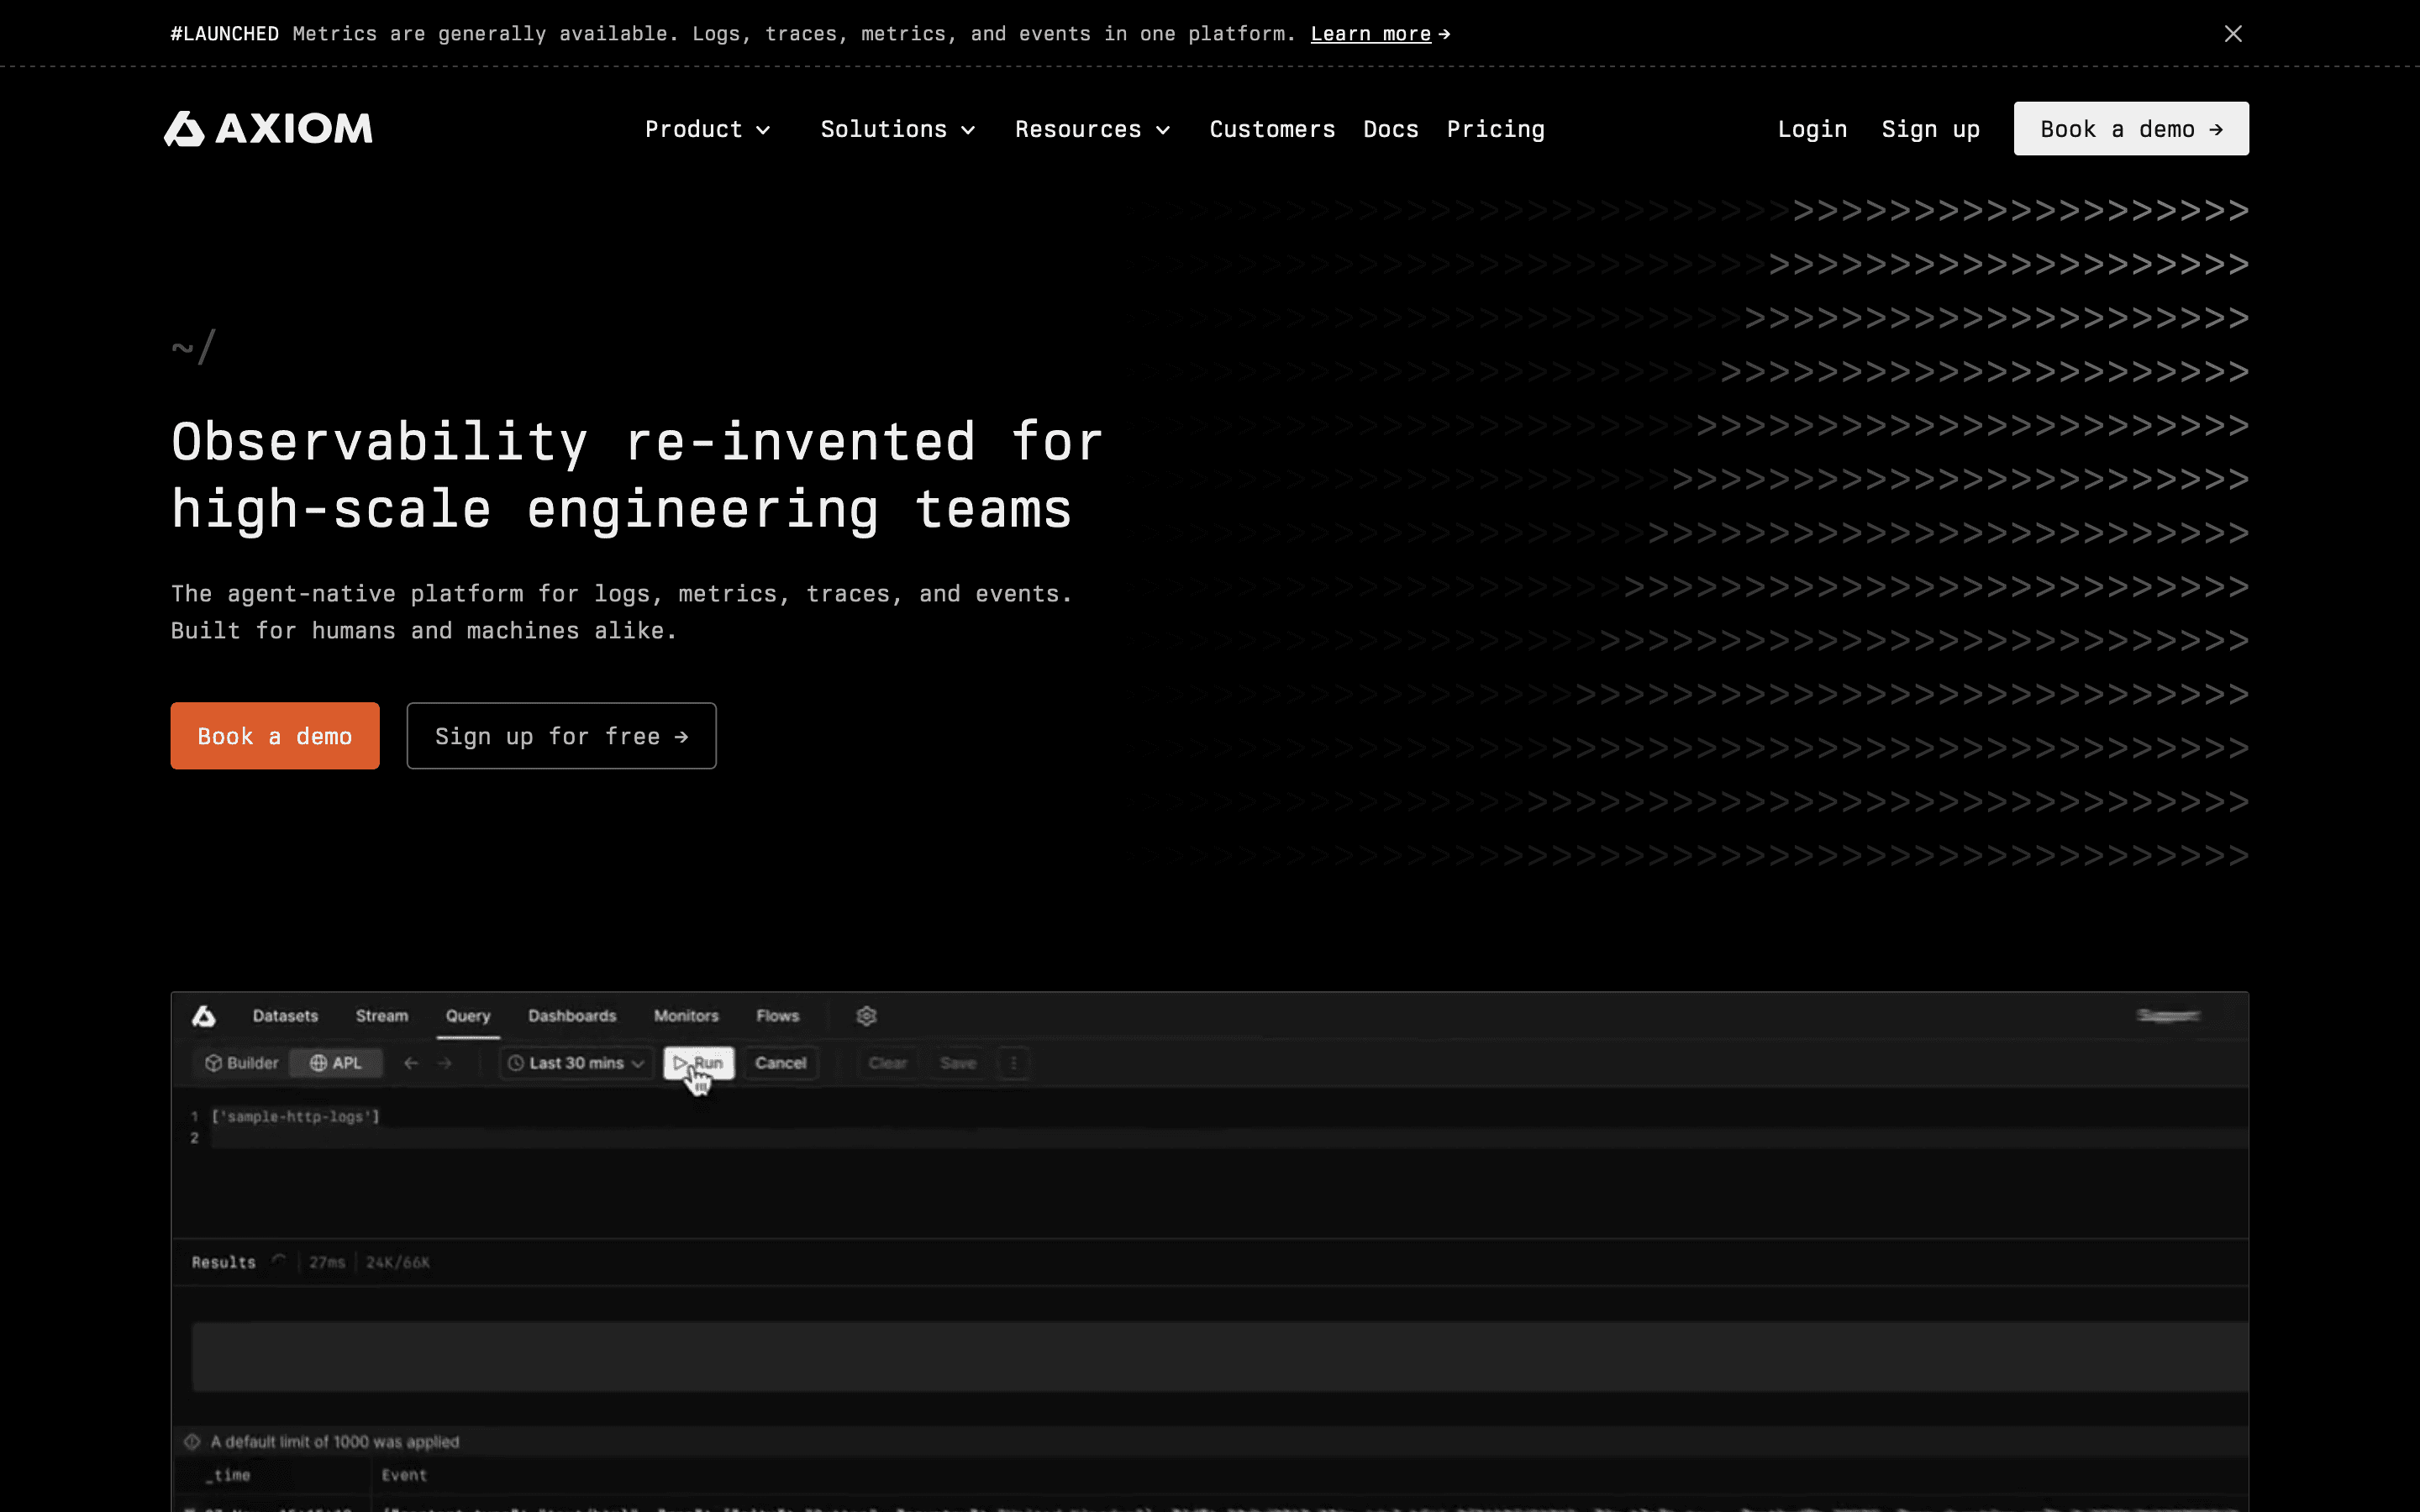
Axiom is the closest match if what actually drove you off Grafana Cloud was the seven-meter bill. It charges one $25/month platform fee plus metered credits for ingest, query compute, and storage, with no per-seat charge and no minimum commitment, so a growing team does not pay more just for adding engineers. Compression keeps storage cheap enough that long retention windows do not blow up the bill the way per-GB-stored tools do, and the free Personal plan's 500 GB/month of data loading is a genuinely usable amount for a side project or small service. The tradeoff is that Axiom's metrics and dashboards are newer and thinner than a dedicated APM tool's, and query compute is still metered, so a bad incident with heavy ad hoc querying can spike costs at the worst time.
Pros
- + Generous always-free allowance (500 GB ingest, 25 GB storage) that's usable for real small projects, not just a trial
- + No minimum commitment on the paid plan, just a $25/month base fee plus metered usage
- + Storage costs are low because of Axiom's compression, so keeping long retention windows doesn't get expensive the way it does on per-GB-stored tools
Cons
- – Query compute is metered, so a bad incident where you're running lots of ad hoc queries and refreshing dashboards can spike your bill right when you're already under pressure
- – The Bring Your Own Cloud plan for data residency has no published price, so teams have to talk to sales to even get a ballpark
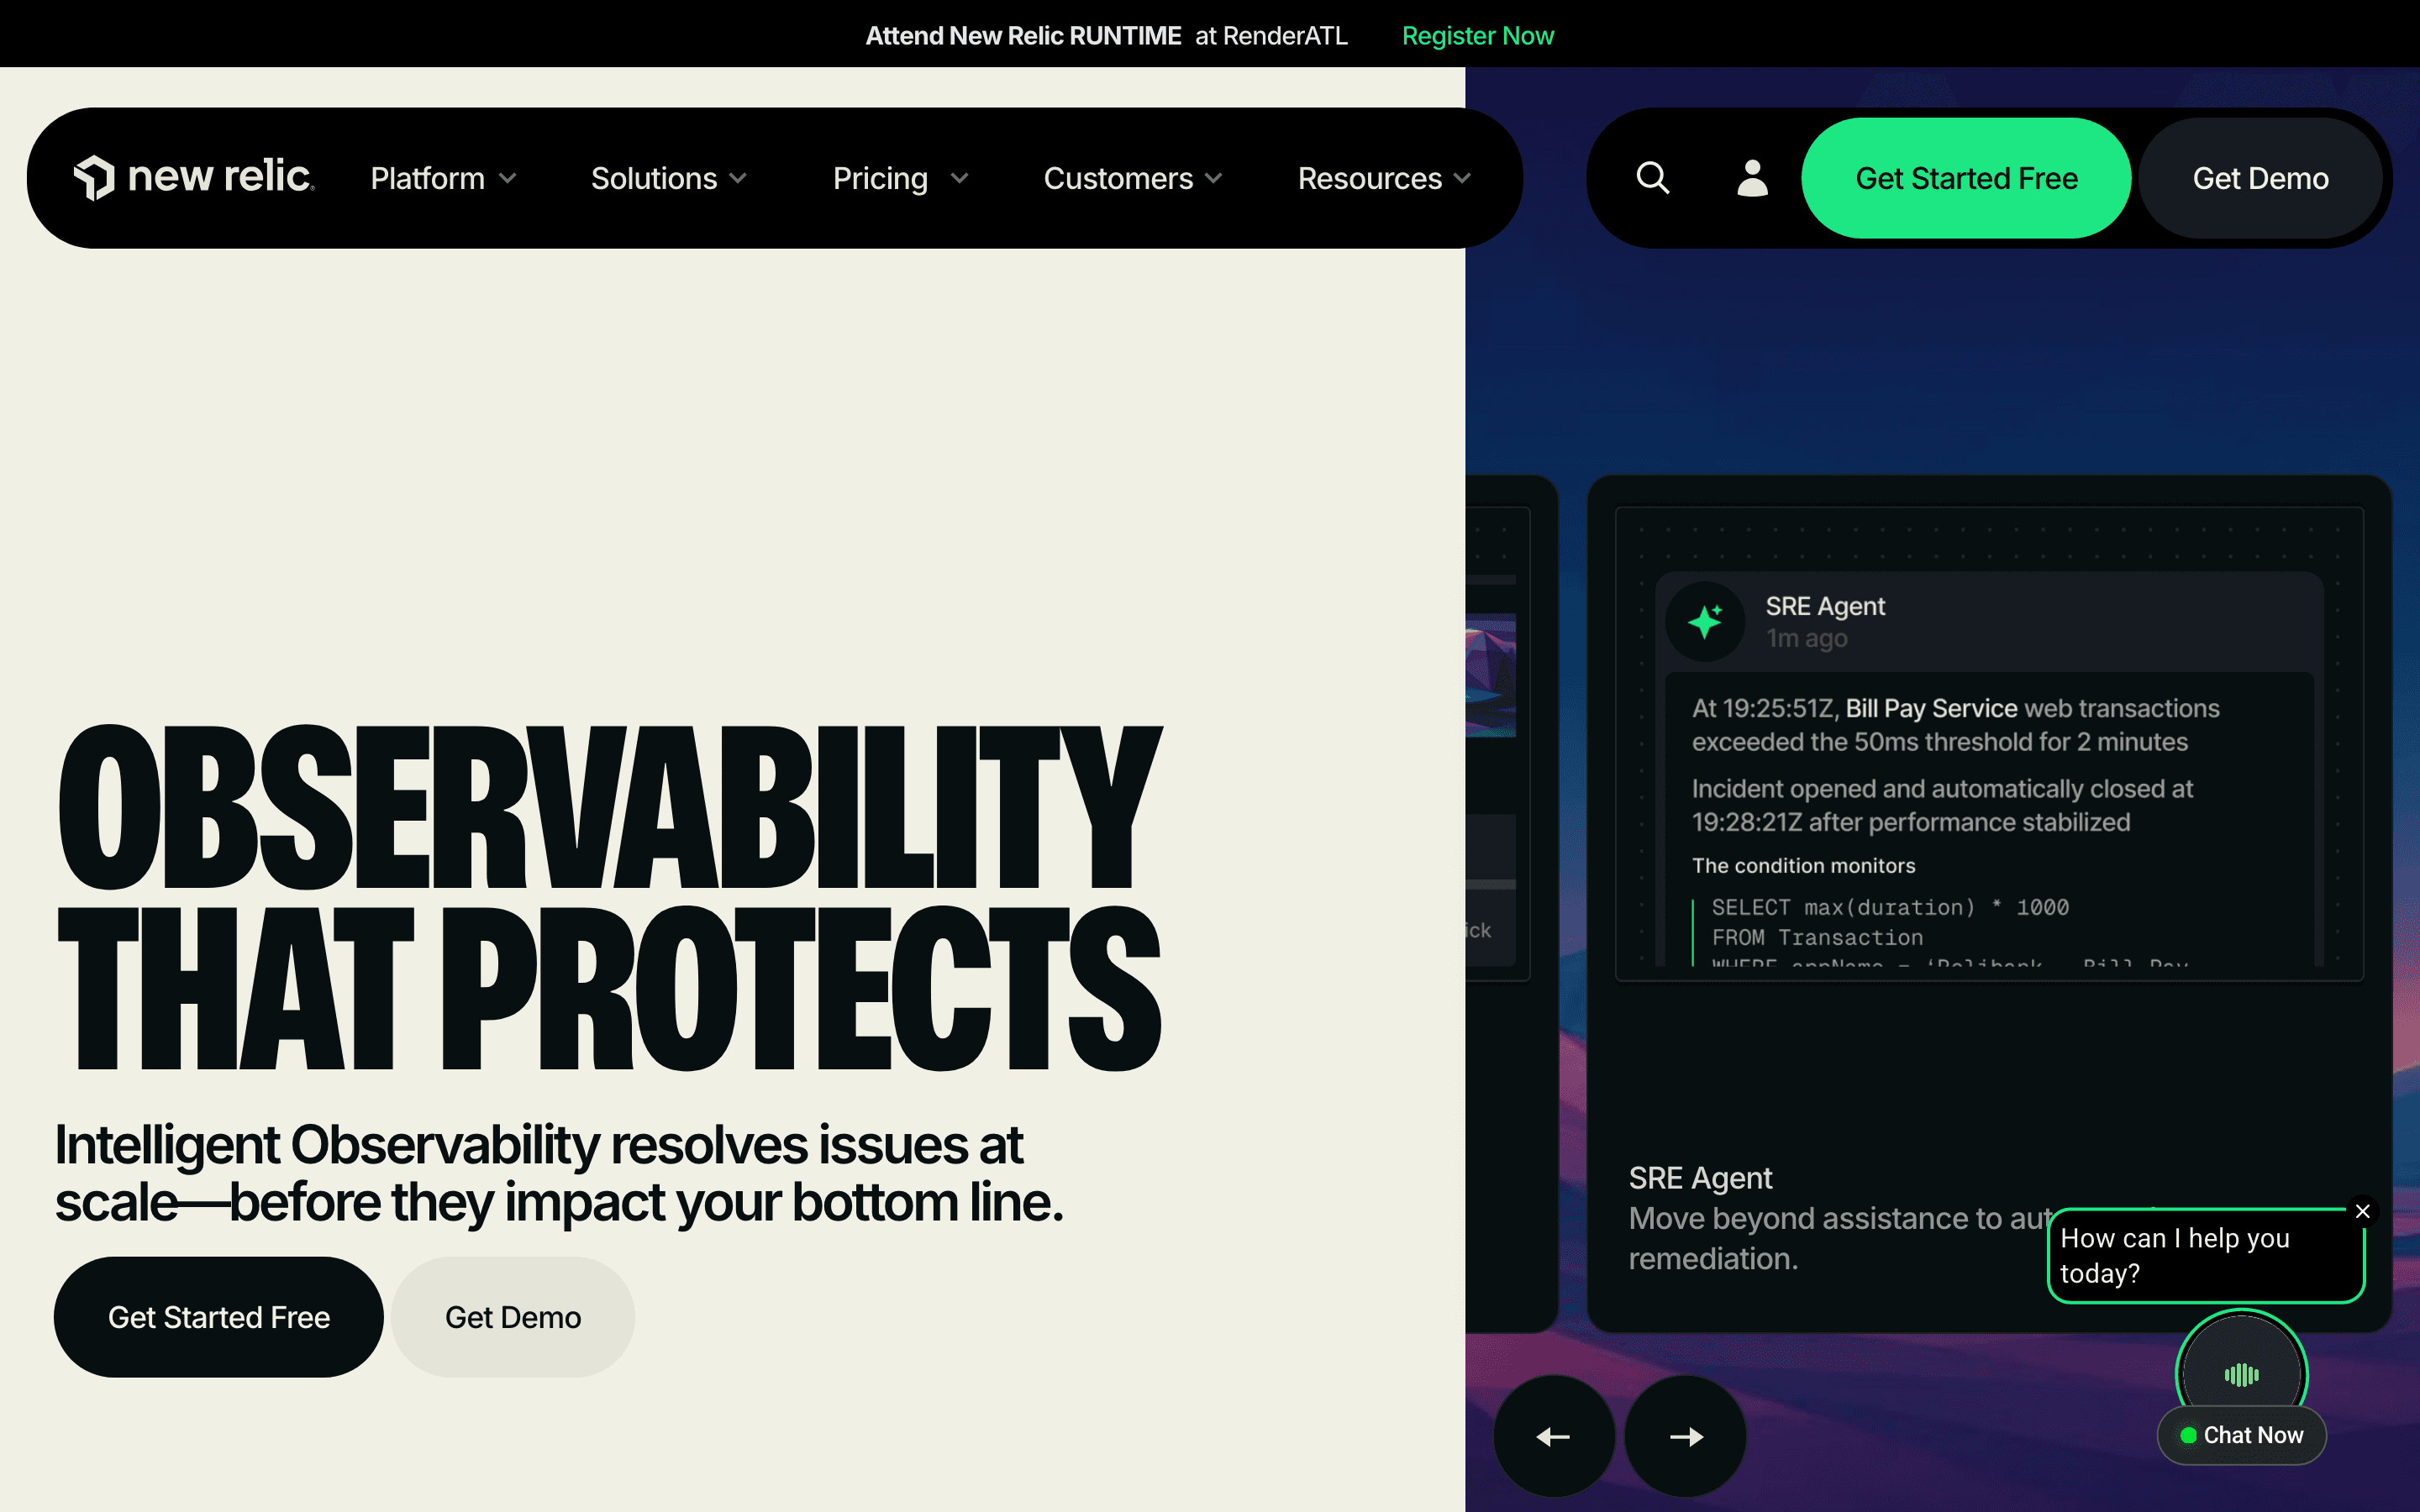
New Relic bundles APM, infrastructure, logs, tracing, and synthetics into one product queried through NRQL, the same one-platform pitch Datadog makes, but it prices differently: a per-user seat fee on top of a per-GB data charge. The free tier is real, 100 GB of ingest and one full platform user forever, which suits a small team that can live within it. Past that, the seats that matter during an incident, the ones with APM and tracing, cost $99 to $418.80 a month each, so teams often restrict most engineers to read-only access. Some customers on older legacy plans have also been pushed to newer pricing at renewal with bills roughly doubling. New Relic fits teams that want one platform and are prepared to negotiate seat count deliberately, not teams that want every engineer to have full access by default.
Pros
- + One platform covers APM, infrastructure, logs, traces, and synthetics, so you're not paying for and maintaining separate tools
- + Genuinely useful free tier: 100 GB/month ingest and one full platform user, no credit card required
- + NRQL gives you a real query language across all your telemetry instead of a fixed set of dashboards
Cons
- – Full platform seats, the tier that unlocks APM and distributed tracing, cost $99-$418.80/month depending on plan, so giving your whole team incident access gets expensive fast
- – Engineers on cheaper Core or Basic seats can't see APM or tracing during an incident, which pushes teams toward screen-sharing with a licensed colleague
Sentry is the odd one out on this list: it starts from error tracking and performance monitoring for application code, not infrastructure dashboards, and has grown outward into logs, uptime checks, and custom dashboards rather than starting there. If most of what breaks in production is an unhandled exception or a slow transaction rather than a saturated host, Sentry ties the error straight back to the release and commit that caused it, and its Seer AI agent can propose a fix and hand it to GitHub Copilot. Pricing is by event volume with unlimited users on paid plans, so team growth does not raise the bill, but a noisy retry loop can spike it in a single day, one documented case put overages at over $7,000 on top of an $80 base. Sentry substitutes for Grafana only for teams whose real need was application error visibility, not infra metrics.
Pros
- + Free Developer plan covers a real amount of usage (5k errors, 5M spans) for solo projects, not just a token trial
- + Every tier's data quota and every overage rate is published on the pricing page, so you can model cost before committing
- + Unlimited users on paid plans means adding teammates doesn't raise the bill
Cons
- – Usage-based billing means a bad deploy or a retry loop can spike your bill in a single day: one documented case put error overages alone at roughly $5,700/month plus $1,560 in span overages on top of the $80 Business base, at 20M errors and 500M spans a month
- – Business-tier overage rates for errors and spans run about double the Team-tier rate at the same volume (e.g. $0.0003 vs $0.00015 per error at the highest usage tier); replay overage is priced the same on both plans
Should your product be on this observability & error monitoring list?
If you build a tool that belongs next to the ones above, submit it. A human reviews every submission. Approved products get their own page with pricing and screenshots, plus a place in the comparisons where they fit. It is free. You sign in with your work email so you can follow the decision, and there is no password to create.
Grafana alternatives: FAQ
What's the best free alternative to Grafana?+
For pure error tracking, Sentry's Developer plan is free for one user with 5,000 errors and 5 million spans a month. For broader observability, New Relic's Free plan gives one user 100 GB of data ingest a month, and Axiom's Personal plan gives one user 500 GB of data loading a month, both bigger free allowances than Grafana Cloud's 50 GB per data type.
Is Datadog cheaper than Grafana Cloud?+
Not necessarily. Datadog starts at $15/host/month for infra monitoring alone, and APM, logs, and other products bill separately on top, similar to how Grafana Cloud meters metrics, logs, traces, and profiles independently. Neither gives you a single flat number without knowing your host count and data volume first.
Which Grafana alternative has the simplest pricing to forecast?+
Axiom comes closest: one $25/month base fee plus metered ingest and query credits, with unlimited users at no extra seat charge. Honeycomb is similar, billing purely on event volume with unlimited seats on every tier.
Can I keep my Prometheus and Loki setup and just get off the Grafana Cloud bill?+
Yes. Grafana's open-source core is free to self-host, so you can keep running your own Prometheus, Loki, and Tempo and pay only for infrastructure. That is why some teams stay on Grafana specifically to avoid taking on a new vendor's meter.
Grafana alternatives: pricing compared
Entry price, billing model, and whether pricing is public. 6 of 6 publish pricing you can check without talking to sales.
| Tool | Starting price | Billing | Free option | Pricing disclosed |
|---|---|---|---|---|
| Grafana | $19/mo | usage-based | Yes | Partly public |
| Datadog | $15/host/mo | usage-based | Yes | Partly public |
| Honeycomb | $150/mo | usage-based | Yes | Partly public |
| Axiom | $25/mo | usage-based | Yes | Partly public |
| New Relic | $10/seat/mo | tiered | Yes | Partly public |
| Sentry | $26/mo | usage-based | Yes | Partly public |
How we made these picks. We compare tools on public pricing, features, and hands-on assessment, then verify every price against the vendor's own page. We never accept payment for rankings. Read the full methodology. Spotted an error? Report it.