Top Sentry Alternatives in 2026
Here for Sentry itself? See the full Sentry profile, pricing & reviews →
Suggest a change- If your team already runs mostly on AWS, GCP, or Azure and wants one vendor for infra, APM, and logs instead of pairing Sentry with something else, choose Datadog. Datadog bundles infrastructure monitoring, APM, and log management in one platform with over 1,000 integrations, so it replaces the extra tools you would otherwise run alongside Sentry.
- If you want a single query language across every kind of telemetry and a generous free tier before you commit to a paid seat, choose New Relic. NRQL queries infra, APM, logs, and traces from one platform, and the free tier includes 100 GB of ingest a month with no credit card, more headroom than Sentry's single-user Developer plan, though Axiom's free tier allows more ingest and Honeycomb's allows more seats.
- If your bugs live in the intersection of specific dimensions like user, region, or build version rather than in a single stack trace, choose Honeycomb. Honeycomb's BubbleUp automatically surfaces which dimensions differ inside an anomaly, which is a different debugging model from reading an exception tied to a release.
- If you want to keep full-fidelity logs and traces at high volume without paying Sentry's per-event overage rates, choose Axiom. Axiom's Cloud plan has no per-seat charge and compresses data cheaply, so a $25/month base fee covers 1,000 GB/month of data loading plus metered credits, and growing volume doesn't multiply the bill the way per-GB-stored tools do.
- If you already run Prometheus, Loki, or Tempo and want a dashboard layer on top of that infrastructure, not a hosted vendor bill, choose Grafana. Grafana's open-source core is free to self-host as a dashboard and query layer over infrastructure you already run. If your only goal is dodging a usage-based bill while keeping error tracking, self-hosting Sentry itself is the closer fit, since Sentry also ships a free self-hosted edition.
- If your team is small, error-focused, and mostly needs exception tracking tied to the exact release and commit that broke, choose stay on Sentry. Sentry's release-based error grouping and Seer AI agent do that specific job better than a general-purpose observability platform, and the free Developer plan covers a real amount of usage for a solo project.
Sentry is built around one job: catching exceptions and tying them to the release and commit that caused them. This guide is for teams that have outgrown that single job and want one platform for infrastructure, APM, and logs together, not for teams that just want a cheaper, like-for-like error tracker.
None of the five tools below are a straight swap for Sentry's core job. Two of them, Datadog and New Relic, are broader, equally usage-metered observability platforms, not cheaper versions of the same thing. The other three solve a genuinely different problem: Honeycomb for high-cardinality debugging, Axiom for cheap high-volume log and trace storage, and Grafana for self-hosted dashboarding. If release-tied exception grouping with stack traces is all you need, a dedicated error tracker will fit better than anything on this list.
The five tools below are for teams ready to trade a dedicated error tracker for something bigger or more DIY. Datadog and New Relic bundle infrastructure and APM into a broader platform. Honeycomb and Axiom stay closer to Sentry's usage-based model but target different debugging styles and budgets. Grafana is the option if you already run your own observability infrastructure and want a dashboard layer on top of it.
Sentry alternatives compared
| Tool | Best for | Starting price | Free option | Last update |
|---|---|---|---|---|
| DatadogBest for one-vendor consolidation | Teams that want one platform for infra, APM, and logs instead of stitching together open source tools | $15/host/mo | Yes | June 2026 |
| New Relic | Teams that want one platform for APM, infra, logs, and traces instead of running several separate tools | $10/seat/mo | Yes | June 2026 |
| HoneycombBest for high-cardinality trace debugging | Teams debugging production issues that need to slice traces by arbitrary high-cardinality fields (user, request ID, feature flag) instead of a fixed dashboard | $150/mo | Yes | June 2026 |
| AxiomBest value at high log and trace volume | Teams that want to keep full-fidelity logs and traces at high volume without paying per-host or per-GB-ingested list price | $25/mo | Yes | June 2026 |
| GrafanaBest for a dashboard layer over infra you already run | Teams that already run Prometheus, Loki, or Tempo and just want a dashboard layer on top | $19/mo | Yes | June 2026 |
Why teams switch from Sentry
Usage-based billing can spike hard after one bad deploy
One documented case put error overages alone at roughly $5,700/month plus $1,560 in span overages on top of the $80 Business base, at 20M errors and 500M spans in a month.
Overage rates roughly double when you move up to the Business tier
At the same usage volume, Business-tier overage on errors and spans runs about double the Team-tier rate, for example $0.0003 versus $0.00015 per error at the highest usage tier.
Enterprise pricing is not published
Teams that outgrow the Business plan have to negotiate a custom Enterprise quote instead of self-serving a number off the pricing page.
Noisy or high-volume error patterns punish you before you have tuned sampling
Chatty third-party scripts and retry loops chew through the prepaid quota fast, which Sentry's own pricing page effectively concedes by warning teams to tune sampling rates and quotas ahead of time.
The best Sentry alternatives, ranked
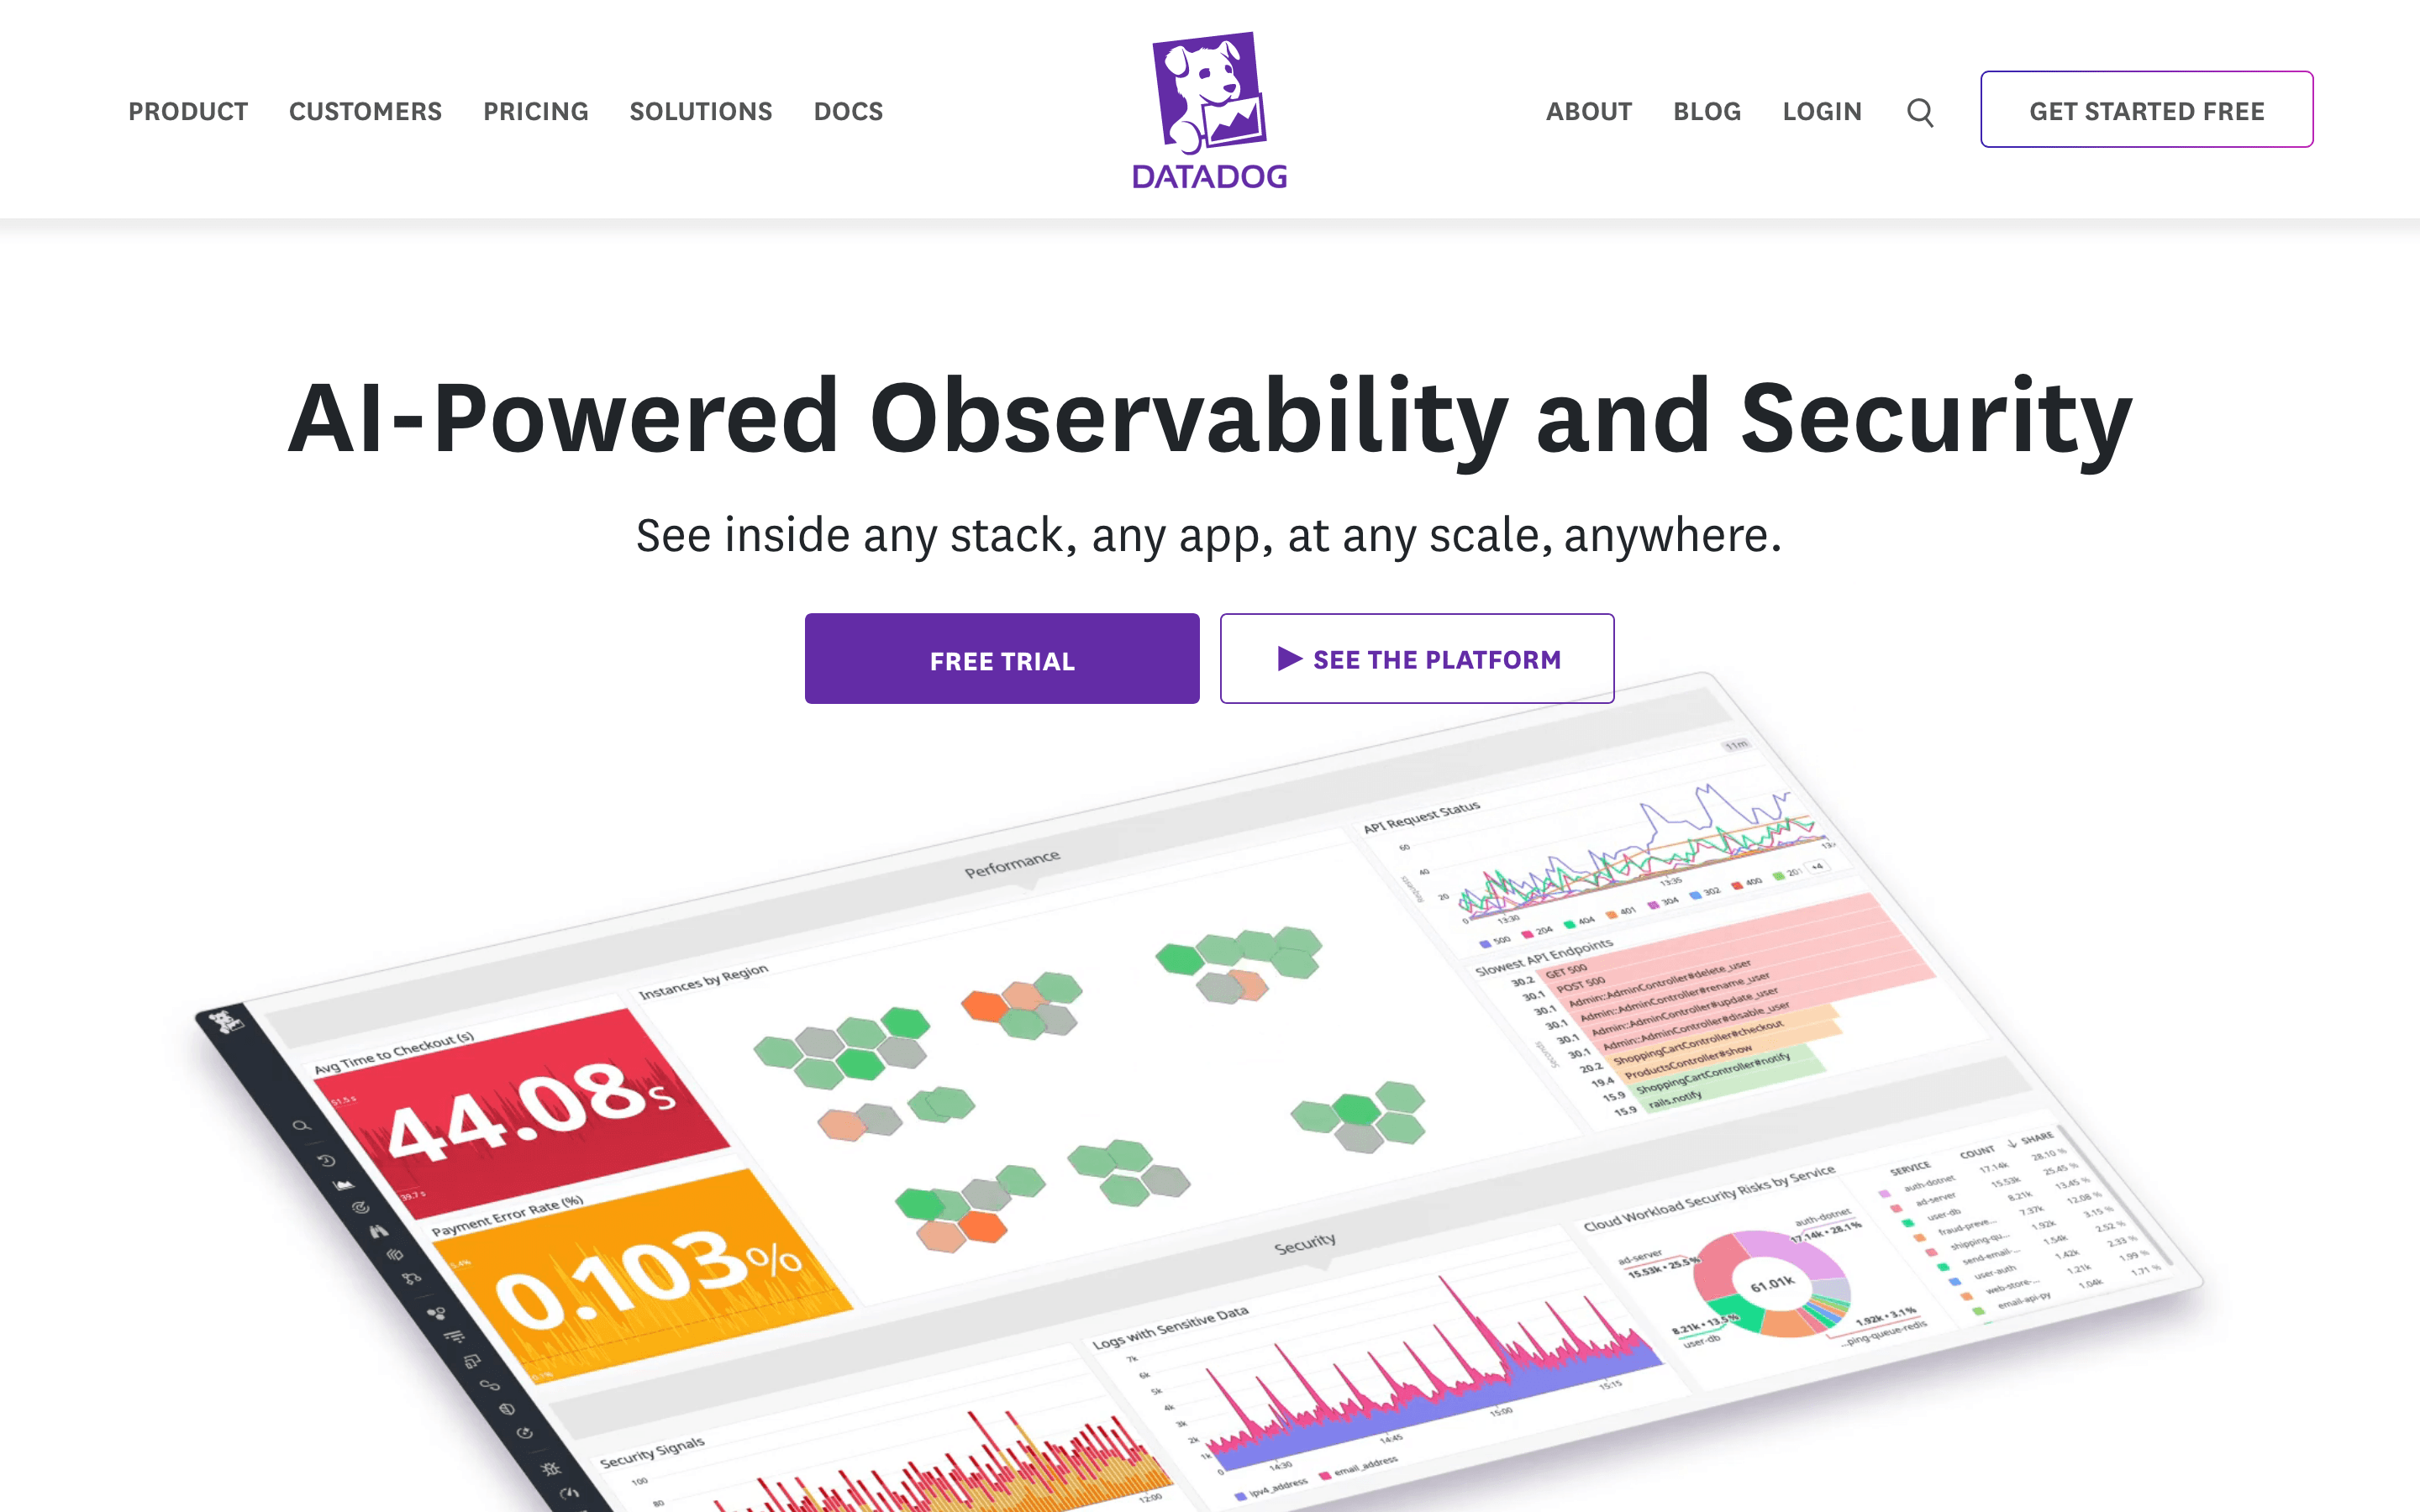
Datadog is the most common upgrade path for teams that outgrow Sentry's error-tracking focus and want one platform for infrastructure, APM, and logs. It plugs into more than 1,000 integrations, so most of your AWS, Kubernetes, and CI tooling connects without custom work. The tradeoff is the bill. Datadog meters hosts, containers, custom metrics, log ingestion, and log indexing separately, so the number on the pricing page rarely matches what you actually pay. Host billing uses a high-water-mark calculation that drops only the top 1% of hourly readings, so a multi-day autoscaling spike can set your whole month's charge. Teams with the headcount to actively manage tags, cardinality, and retention get the most out of it. Teams that want Sentry's simpler, more predictable model will find Datadog's per-product billing a real adjustment.
Pros
- + Covers infra, APM, logs, RUM, and security in one product with shared dashboards and one query language
- + 1,000+ integrations, so most cloud services and tools plug in without custom work
- + Free tier and 14-day trial with no credit card, so you can test it before committing
Cons
- – Pricing is split across many separately metered products (hosts, containers, custom metrics, log ingestion, log indexing), so the real bill is hard to predict from the pricing page alone
- – Host billing excludes only the top 1% of hourly readings each month, so a multi-day autoscaling spike, not just a brief one, can set the whole month's charge at that peak
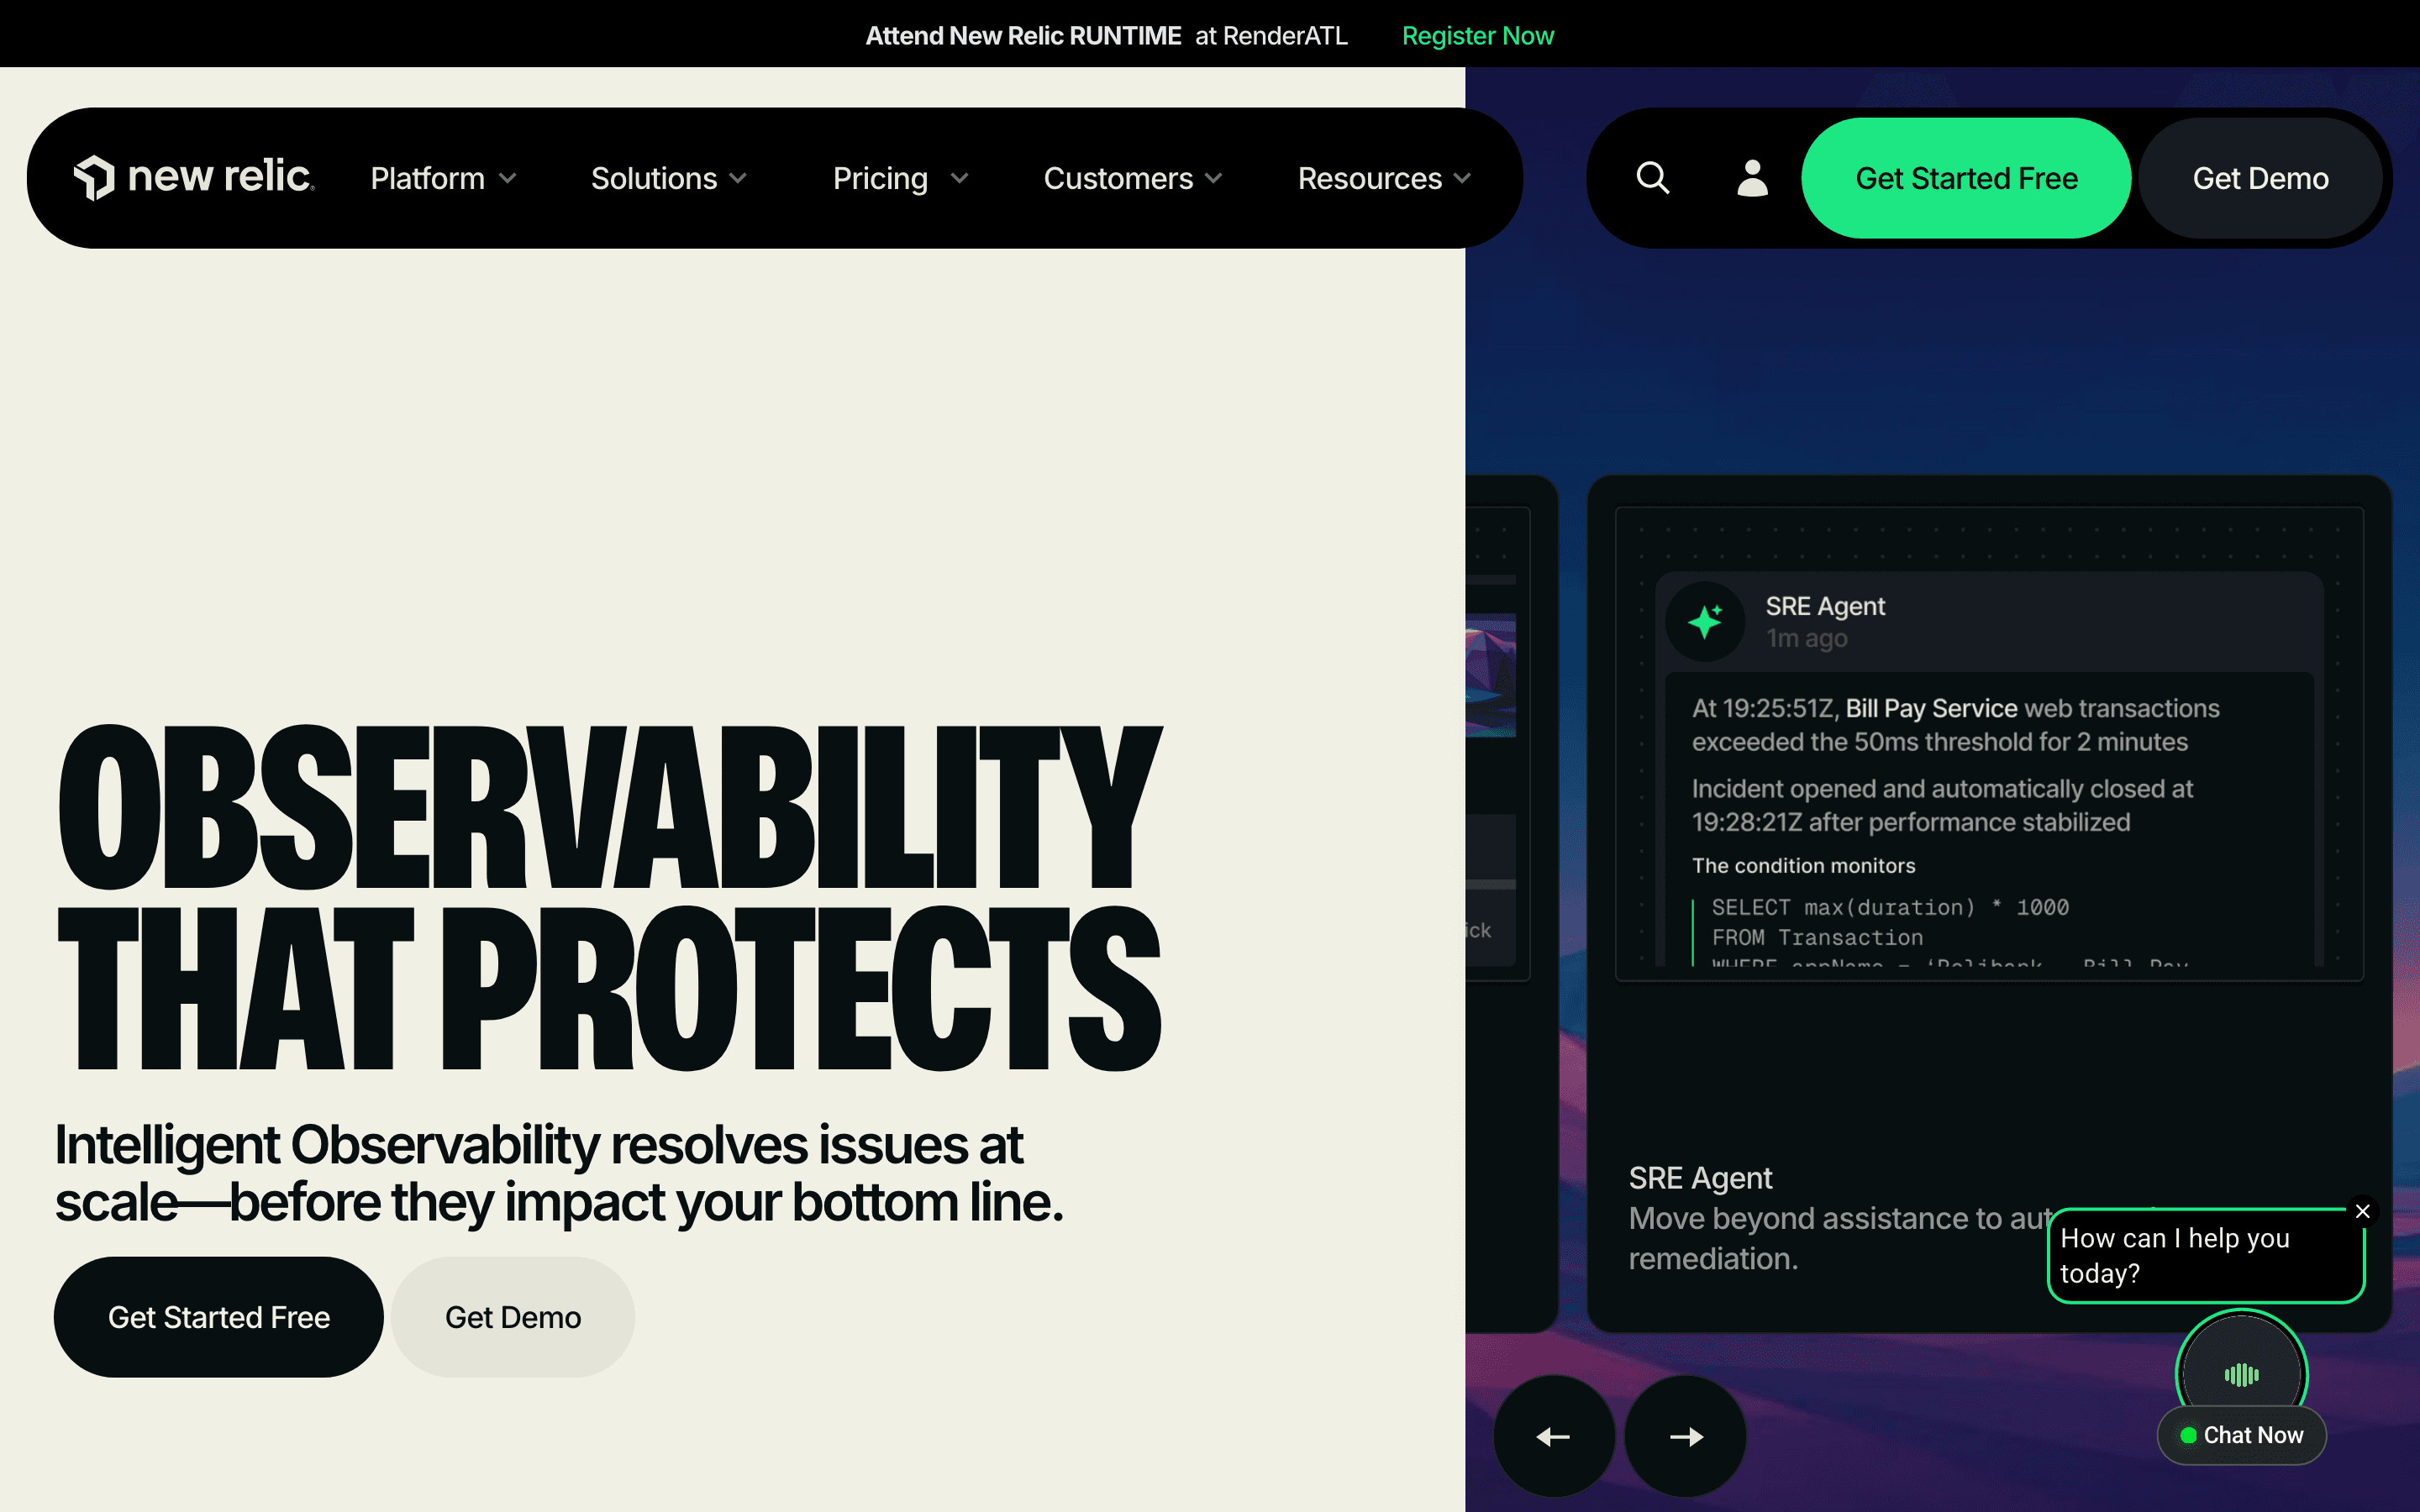
New Relic covers APM, infrastructure, logs, and tracing in one product queried through NRQL, a real advantage if you want one query language across every kind of telemetry instead of separate views for errors and traces. Its free tier is generous for a single power user: 100 GB of data ingest a month with one full platform user, no credit card required. It is not the most generous free tier in this group on either measure, though: Axiom's free Personal tier allows 500 GB/month of data loading, and Honeycomb gives unlimited seats and querying on every tier, including free, where New Relic caps free access at one full platform user. The catch is that the seat which actually unlocks APM and tracing during an incident costs $99 to $418.80 a month, so giving your whole engineering team incident access gets expensive fast. Data overage on top of that runs $0.40 to $0.60 per GB. New Relic fits teams that can concentrate full access on a few engineers and route the rest through screen-sharing, not teams that want every developer to see a stack trace the moment it fires.
Pros
- + One platform covers APM, infrastructure, logs, traces, and synthetics, so you're not paying for and maintaining separate tools
- + Genuinely useful free tier: 100 GB/month ingest and one full platform user, no credit card required
- + NRQL gives you a real query language across all your telemetry instead of a fixed set of dashboards
Cons
- – Full platform seats, the tier that unlocks APM and distributed tracing, cost $99-$418.80/month depending on plan, so giving your whole team incident access gets expensive fast
- – Engineers on cheaper Core or Basic seats can't see APM or tracing during an incident, which pushes teams toward screen-sharing with a licensed colleague
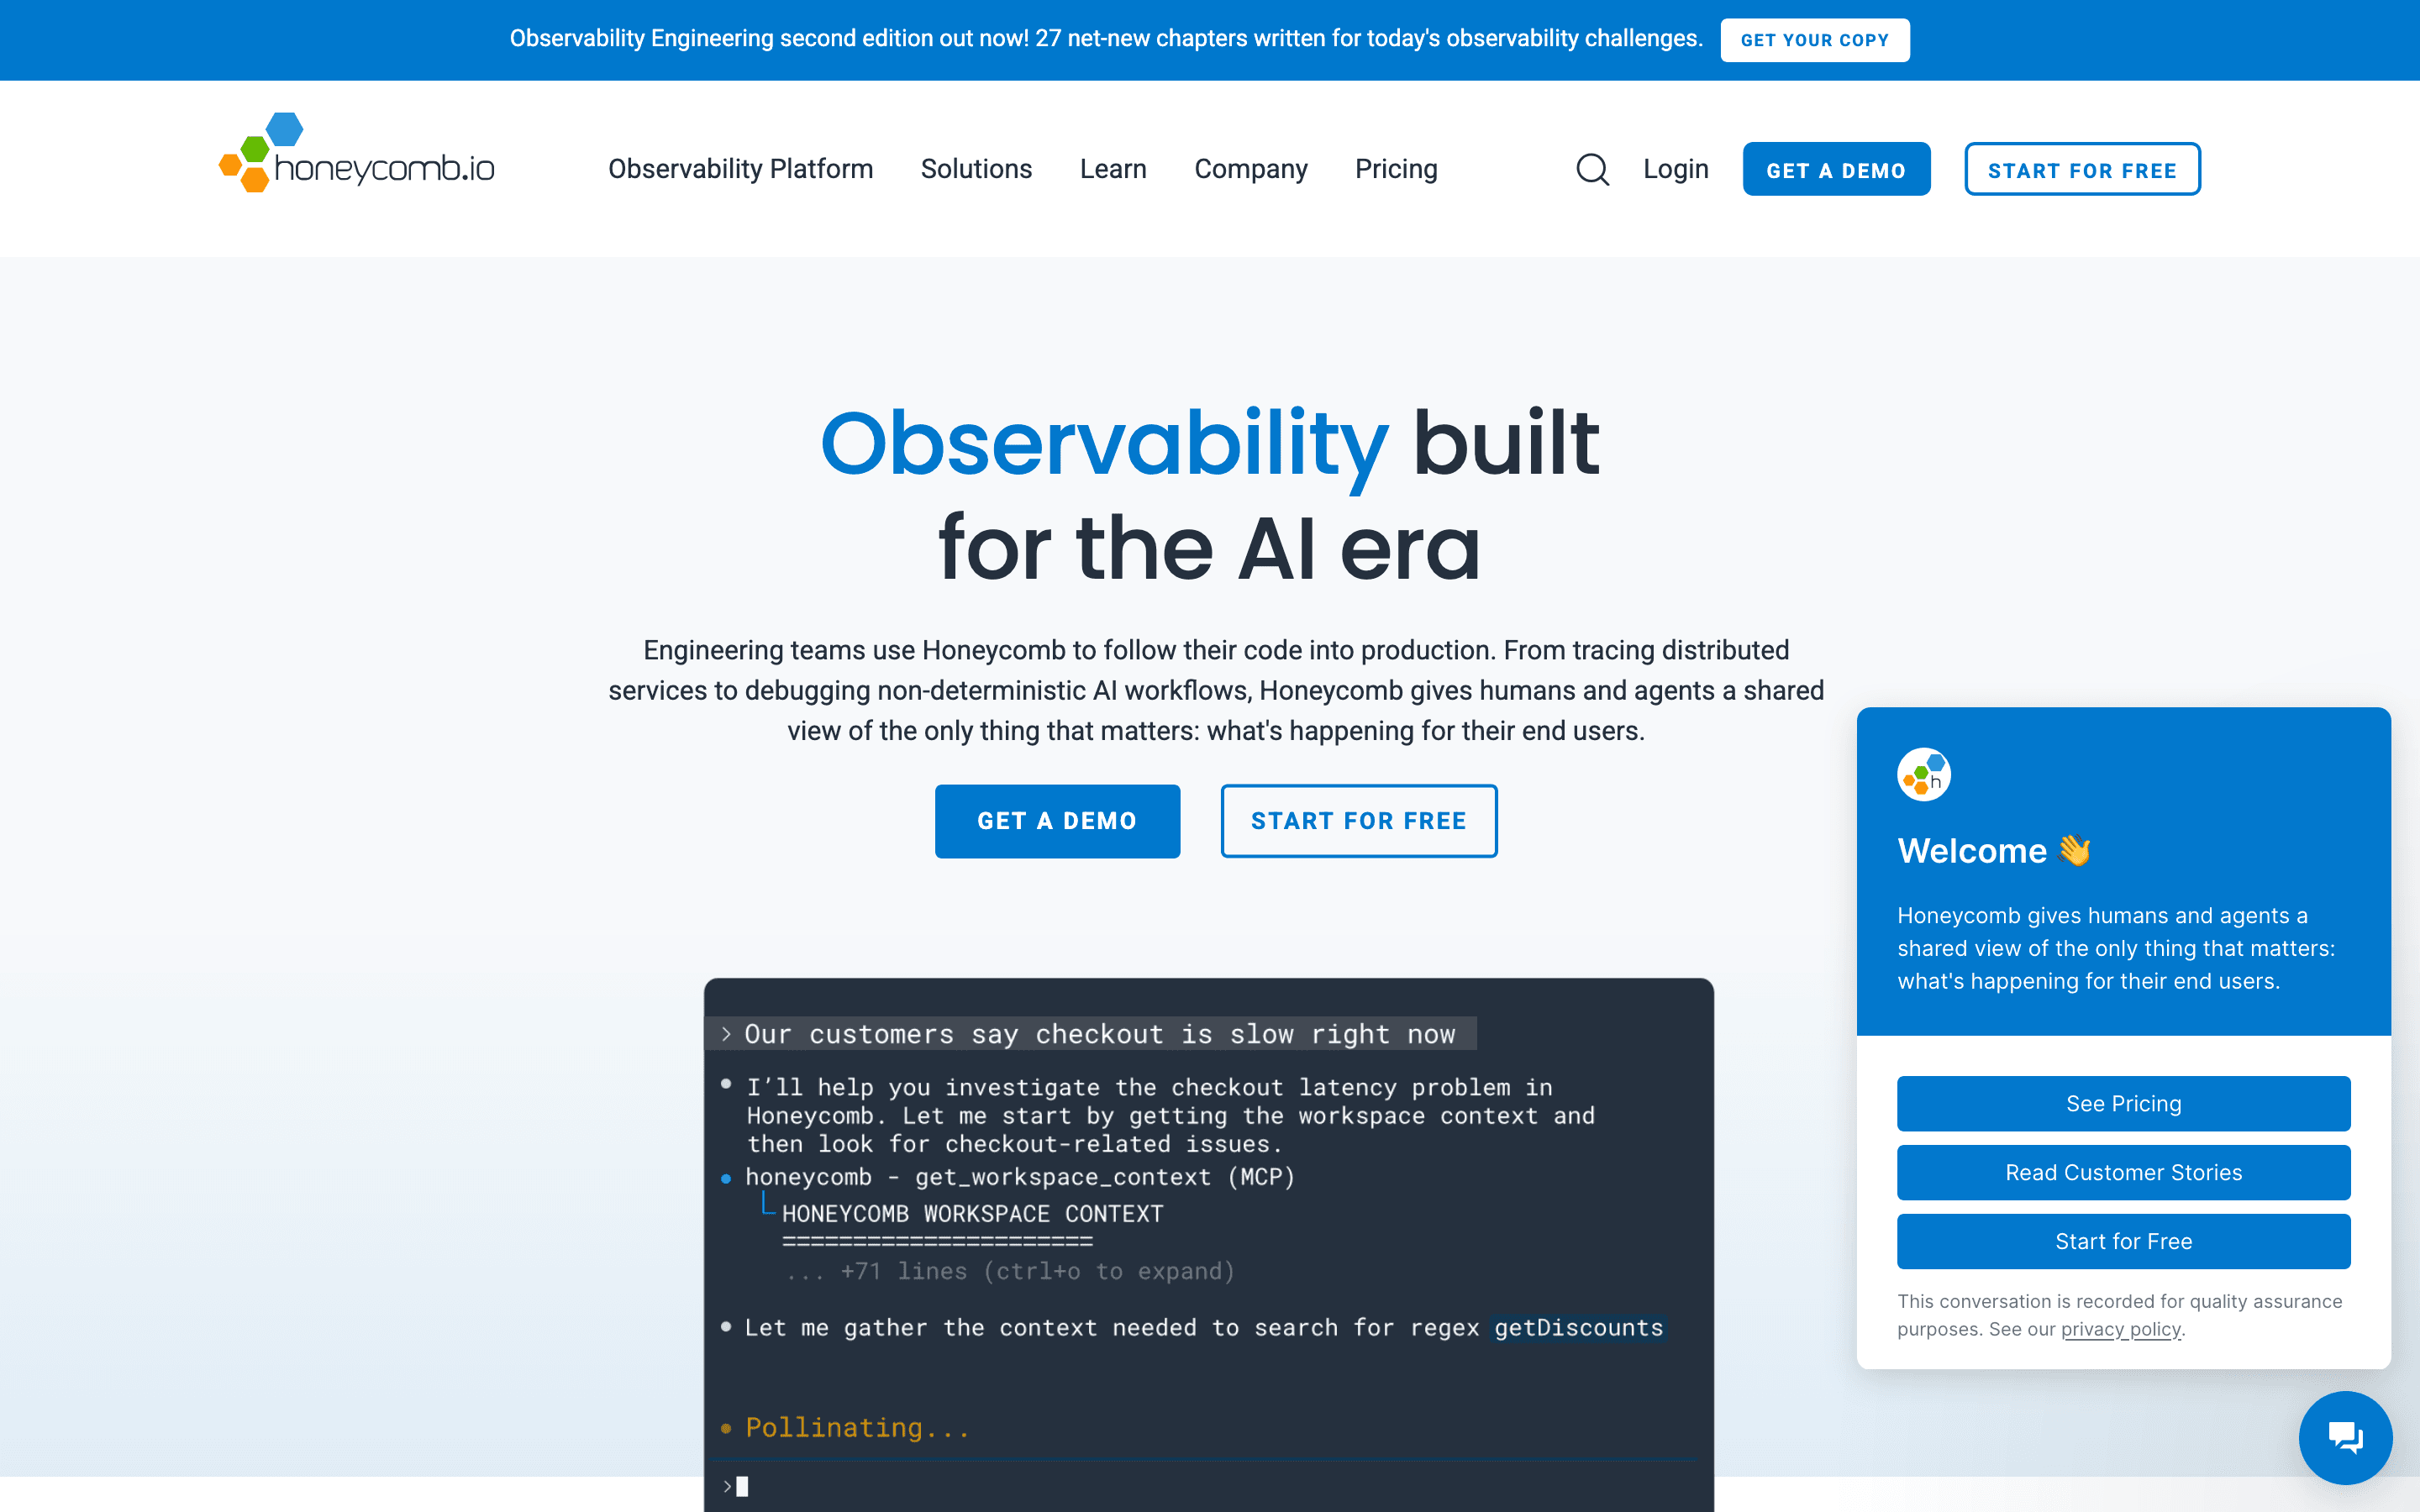
Honeycomb solves a different problem than Sentry's release-tied error grouping. It is built for teams whose bugs live in the intersection of user, region, and build version rather than in a single stack trace. BubbleUp draws a box around an anomaly and surfaces which dimensions differ in that group automatically, a genuinely different debugging model from reading an exception. Seats and querying are unlimited on every tier, so a bigger team does not raise the bill, and the free tier's 20M events a month is usable for a real small service. Pricing tracks event volume, so an unsampled deploy or a spike in trace depth can push costs up without any change in headcount or hosts. It has no built-in infrastructure monitoring, so most teams still pair it with something else for that.
Pros
- + BubbleUp finds the differentiating dimensions of an anomaly automatically instead of making you guess which graph to check next
- + Query latency stays fast even on very high-cardinality fields, which is the specific weakness of most metrics-first tools
- + Free tier is genuinely usable for small projects at 20M events and 100M metrics points a month
Cons
- – Bill scales with event volume, so a spike in trace volume or an unsampled deploy can jump your usage without any seat or infra change
- – Enterprise pricing is quote-only, so budgeting past Pro's ~750M events/month requires a sales conversation
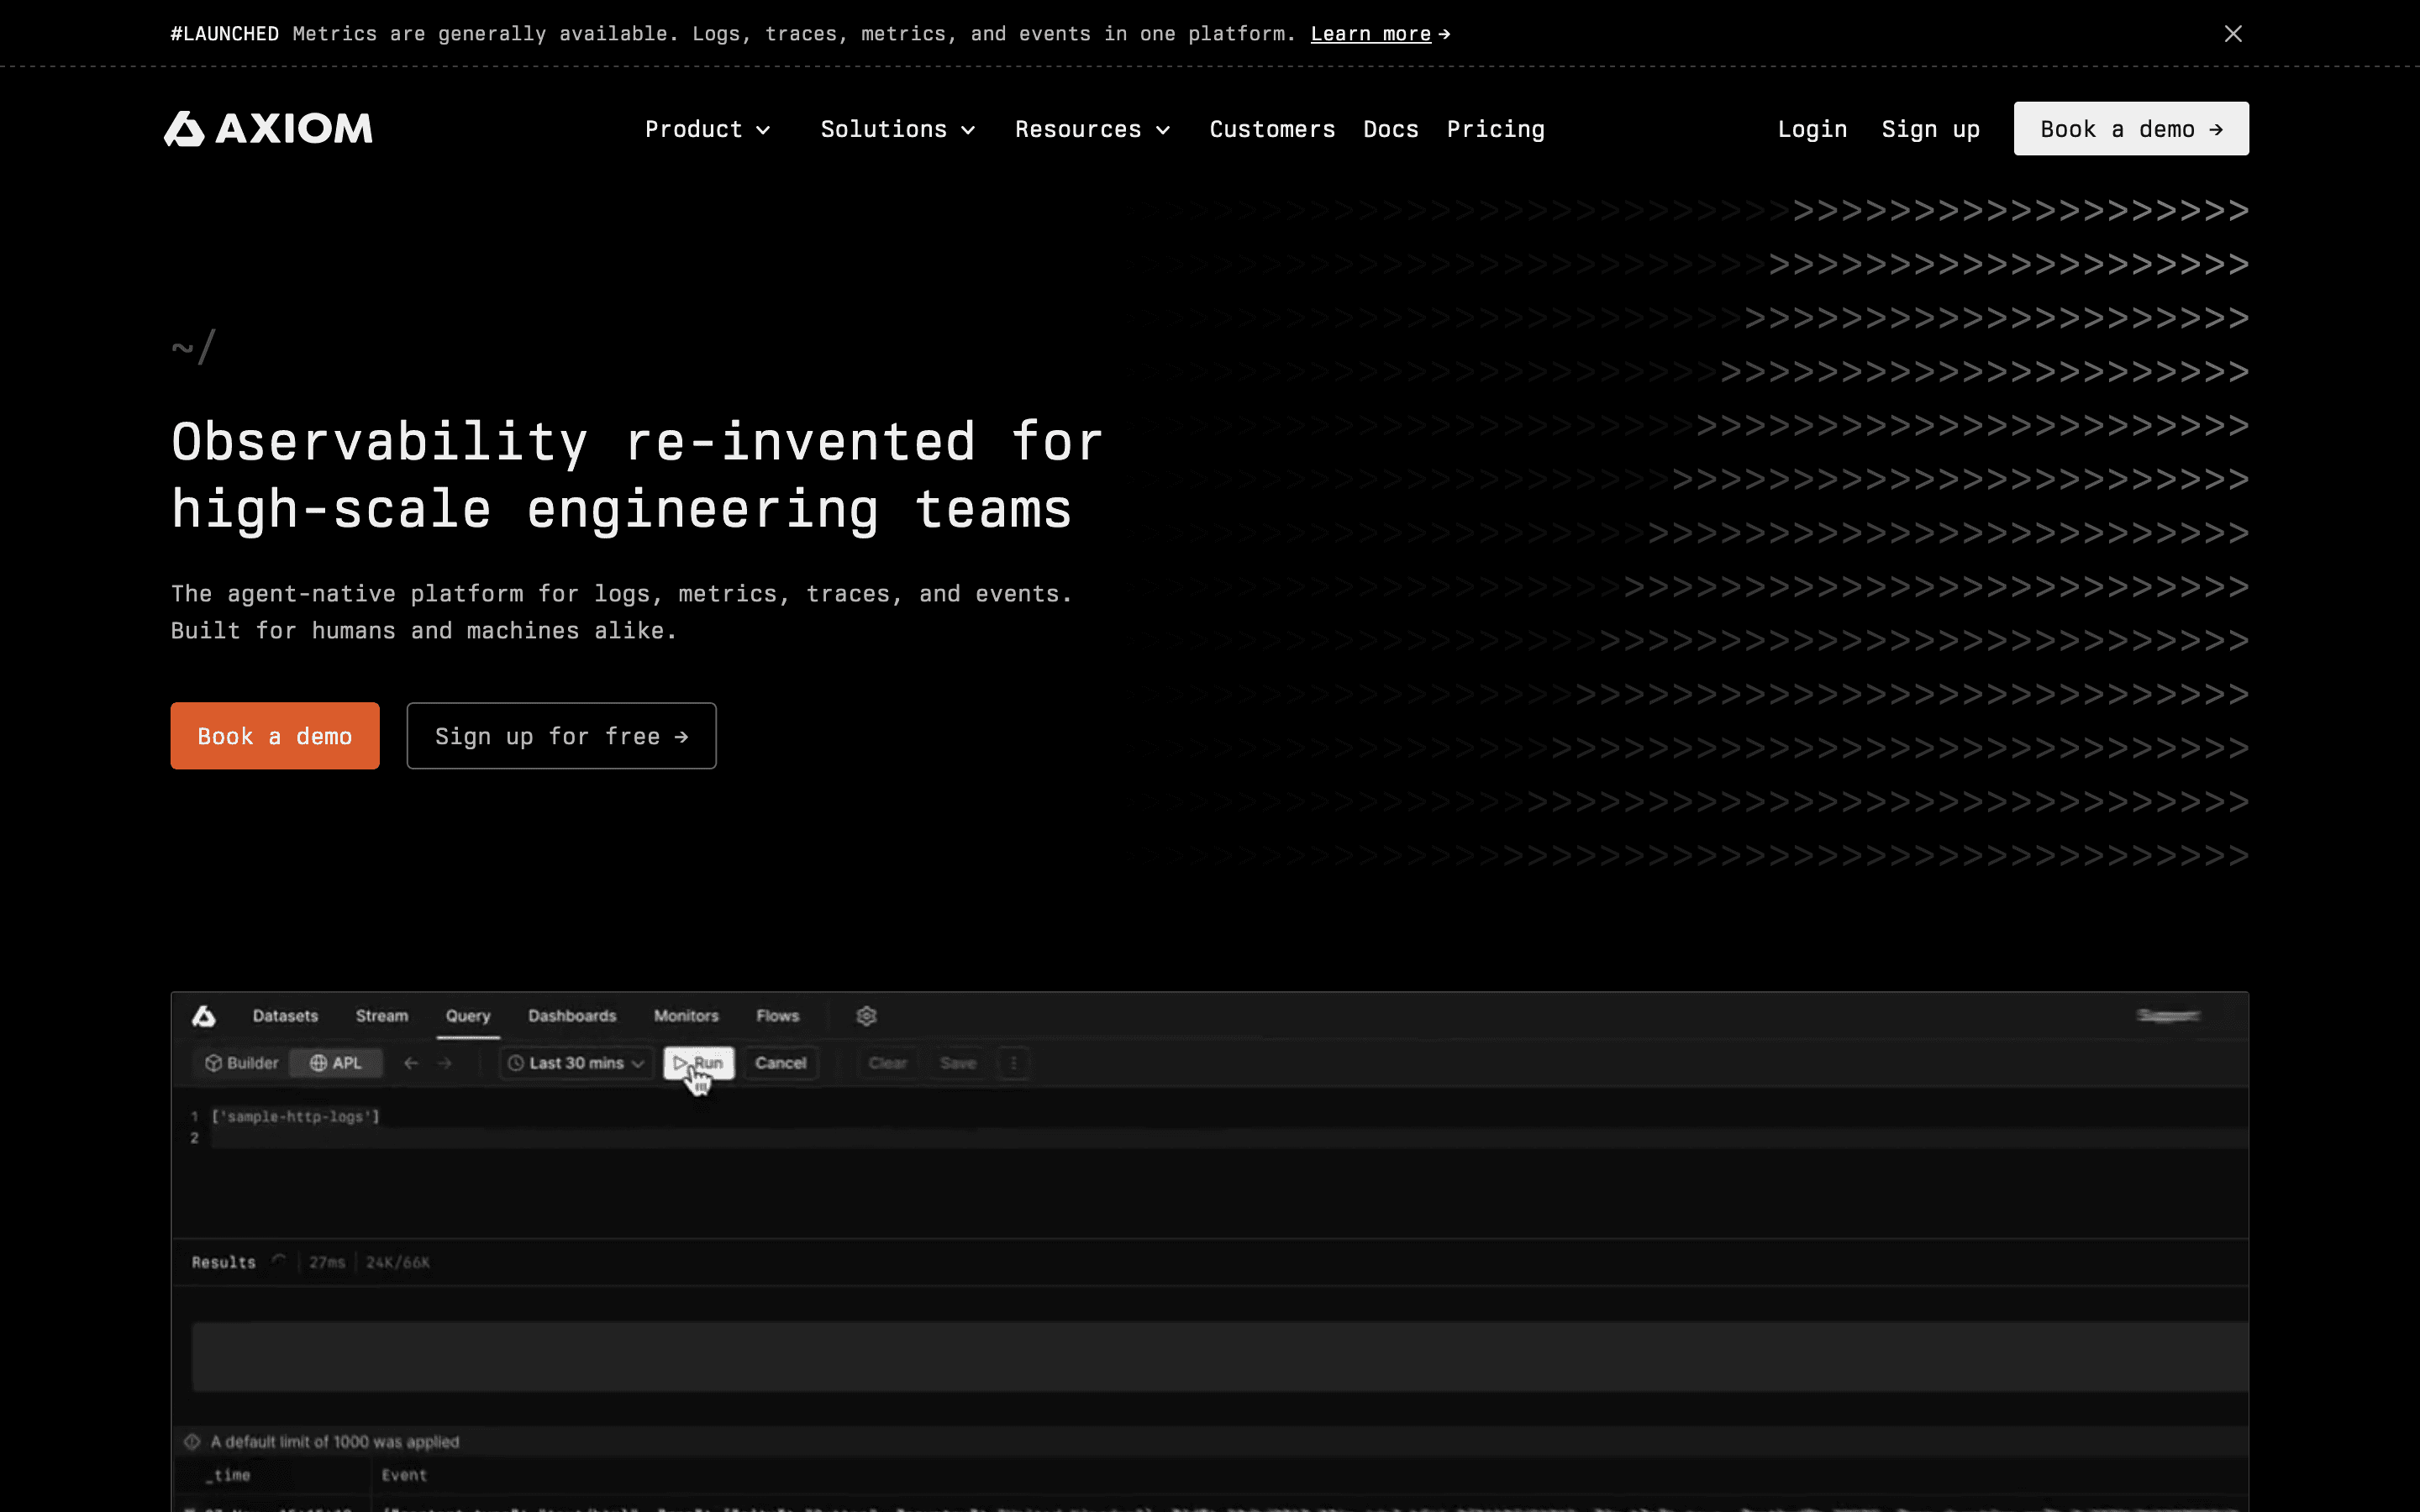
Axiom is the budget-conscious pick among Sentry's alternatives: a $25/month platform fee, no per-seat charge, and 1,000 GB/month of data loading included on that paid Cloud plan. Below that, Axiom's always-free Personal tier gives 500 GB/month of data loading on its own, with no charge at all, but it caps out at one user and 25 GB of storage, so it suits a side project more than a team. Axiom's compression keeps storage cheap, so holding onto full-fidelity logs and traces for longer does not multiply the bill the way per-GB-stored tools do. It fits teams already comfortable writing queries in APL rather than clicking through a fixed dashboard builder, and it is popular with teams already on Vercel or Cloudflare Workers. What it does not have is mature APM, session replay, or the release-tied error tracking Sentry built its name on, so teams moving here are usually optimizing for cheap logs and traces, not for a like-for-like error tracker. Query compute is metered too, so the bill can climb fastest exactly when you are running the most diagnostic queries during an incident.
Pros
- + Generous always-free allowance (500 GB ingest, 25 GB storage) that's usable for real small projects, not just a trial
- + No minimum commitment on the paid plan, just a $25/month base fee plus metered usage
- + Storage costs are low because of Axiom's compression, so keeping long retention windows doesn't get expensive the way it does on per-GB-stored tools
Cons
- – Query compute is metered, so a bad incident where you're running lots of ad hoc queries and refreshing dashboards can spike your bill right when you're already under pressure
- – The Bring Your Own Cloud plan for data residency has no published price, so teams have to talk to sales to even get a ballpark
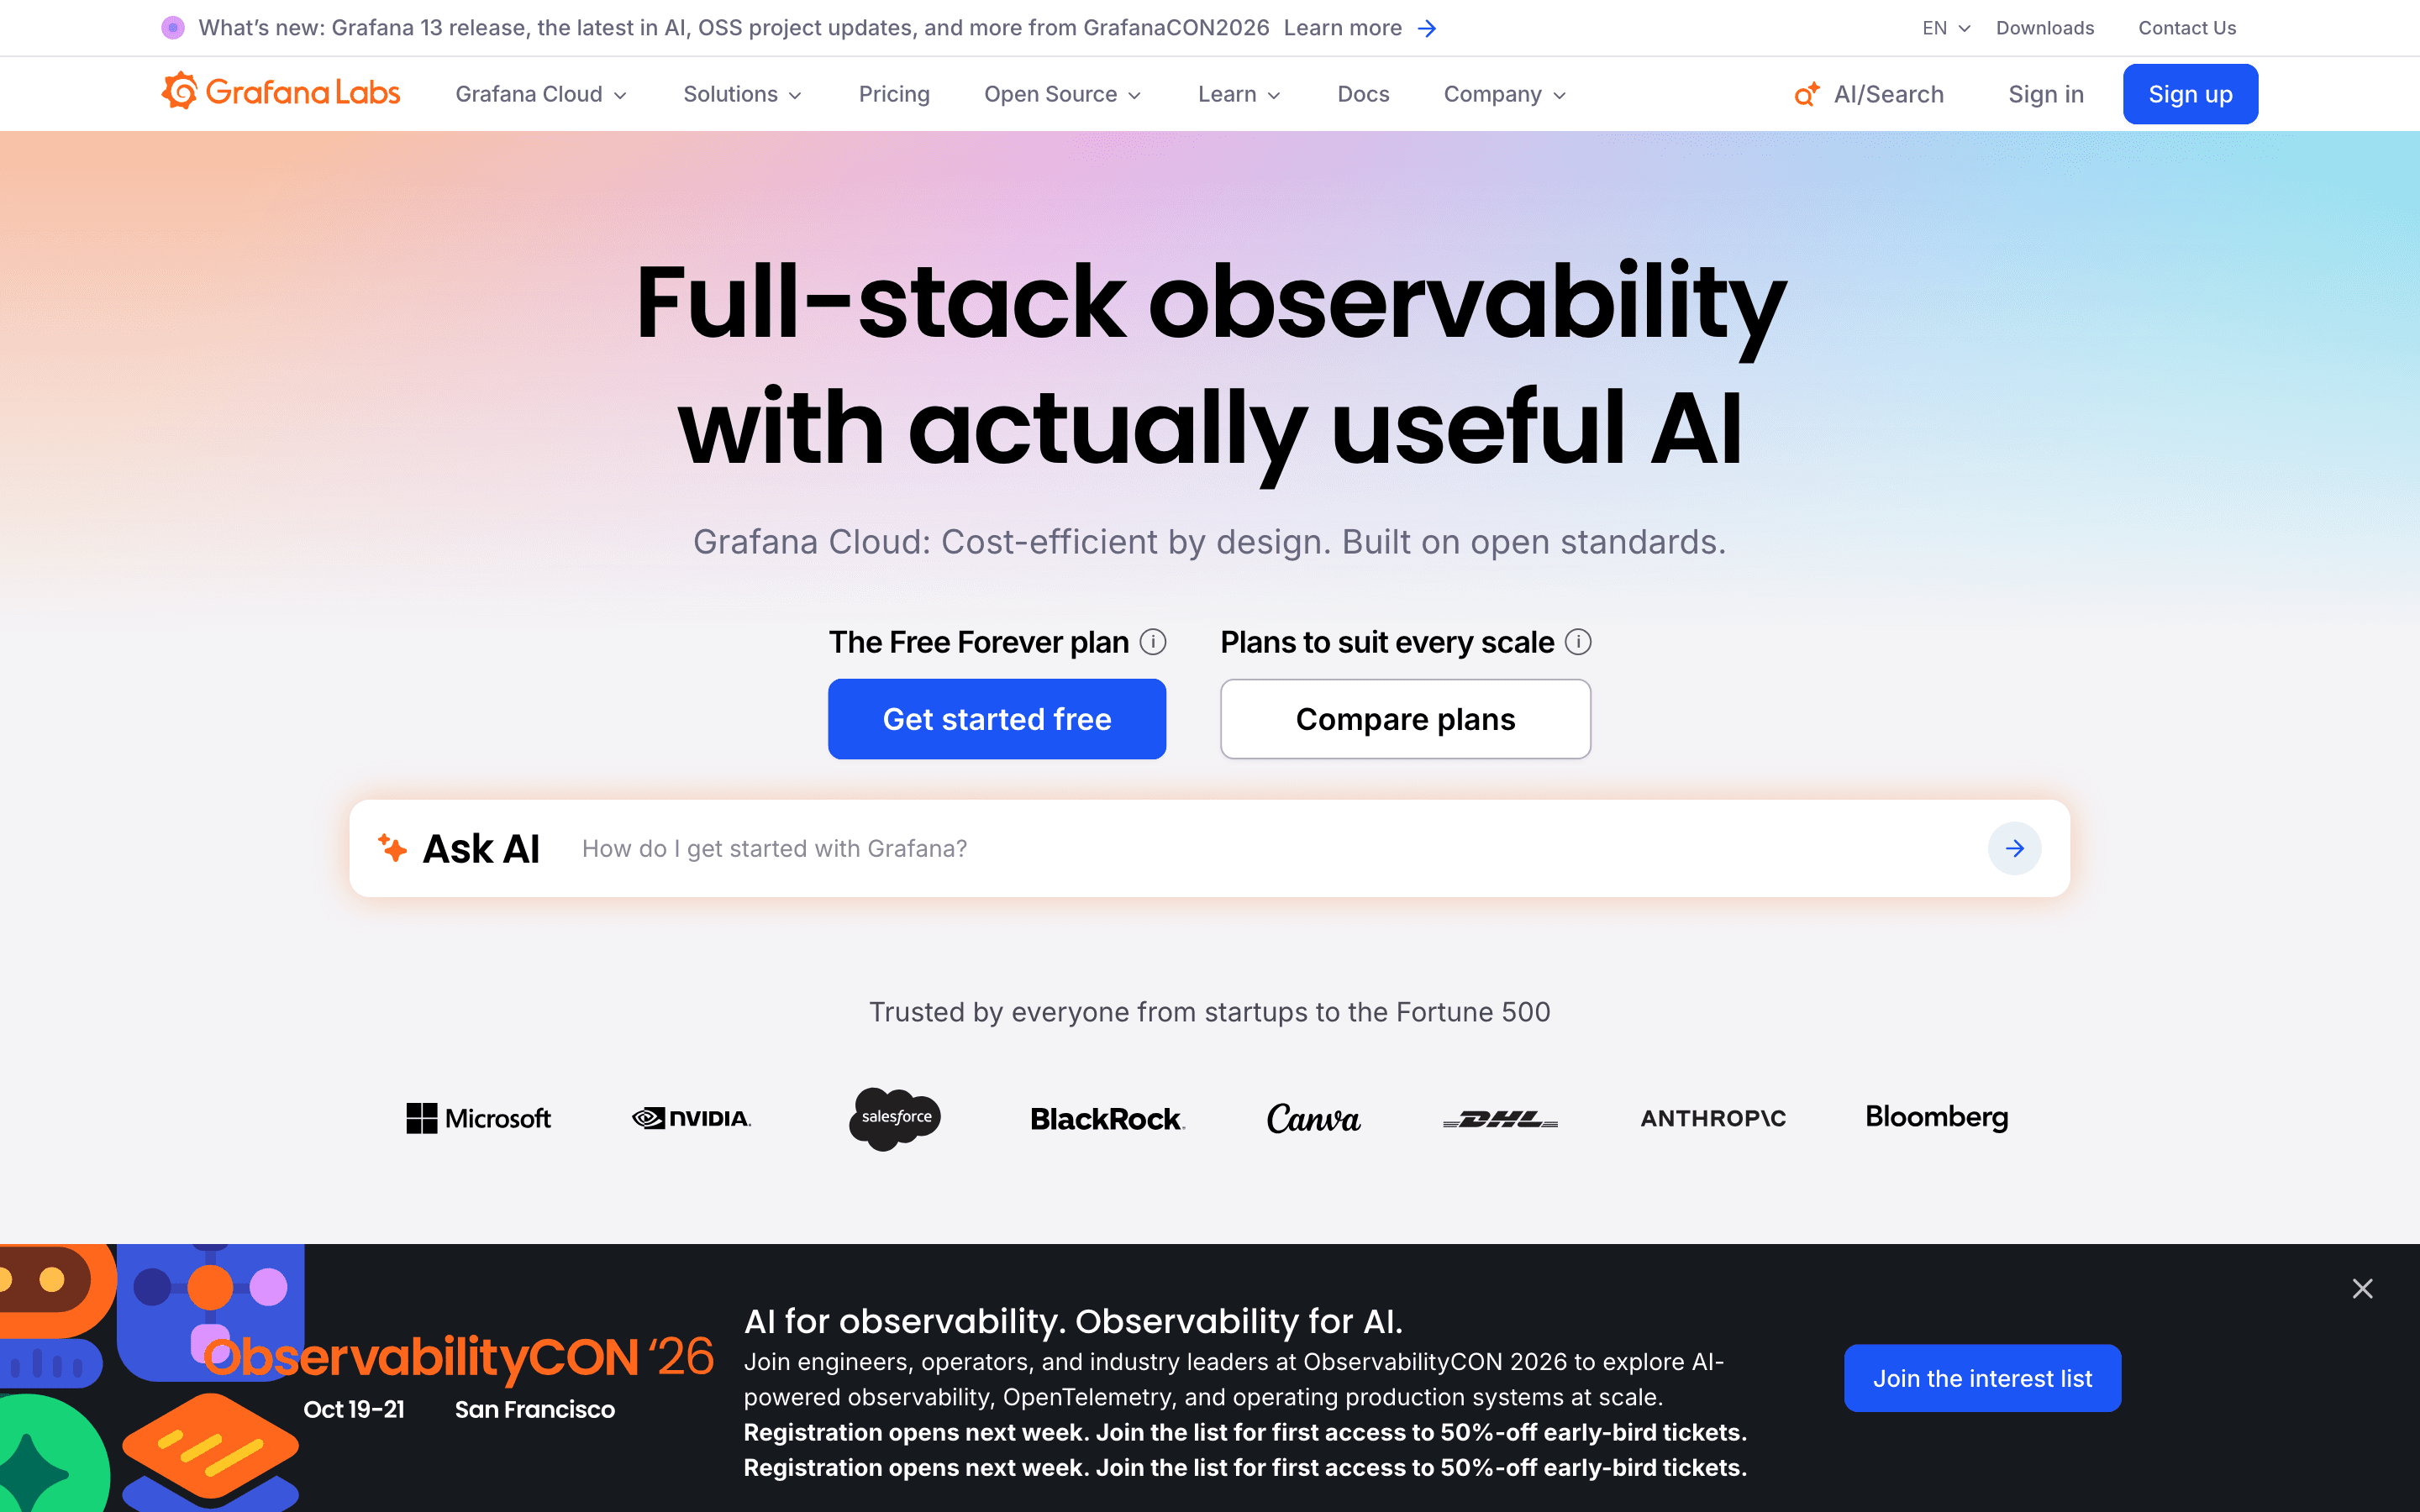
Grafana is the option for teams that already run their own observability infrastructure and want a dashboard layer on top of it, not a way to escape usage-based billing on principle. The open-source core, the LGTM stack of Loki, Grafana, Tempo, and Mimir, is genuinely free to self-host, and Grafana Cloud's free tier of 10k metric series and 50 GB each of logs, traces, and profiles is real. The catch is that metrics pricing is driven by cardinality, not raw volume, so adding labels or standing up a second Kubernetes cluster can multiply your series count and your bill faster than expected. Grafana also is not built around release-tied exception tracking the way Sentry is. It is a dashboarding and query layer over whatever backend you point it at, so it fits platform teams already running Prometheus, Loki, or Tempo who want visualization on top, not teams that want error tracking out of the box. If avoiding a usage-based bill is the actual goal, self-hosting Sentry itself keeps the same release-tied error tracking without a usage meter, since Sentry ships a free self-hosted edition too.
Pros
- + Real free forever tier: 10k metric series and 50 GB each of logs, traces, and profiles per month, no credit card
- + Self-hosting the open-source core is a genuine option, not just a marketing claim, so you're never fully locked into the cloud bill
- + Volume discounts kick in automatically as usage grows, and Adaptive Metrics/Adaptive Logs can cut ingested volume automatically
Cons
- – Metrics pricing is driven by cardinality, not raw data volume, so adding labels or a second Kubernetes cluster can multiply your series count and your bill far faster than you'd expect
- – Costs are metered across seven or more independent dimensions (metrics, logs, traces, profiles, k6, synthetics, hosts), each with its own rate, which makes the bill hard to forecast
Should your product be on this observability & error monitoring list?
If you build a tool that belongs next to the ones above, submit it. A human reviews every submission. Approved products get their own page with pricing and screenshots, plus a place in the comparisons where they fit. It is free. You sign in with your work email so you can follow the decision, and there is no password to create.
Sentry alternatives: FAQ
What's the best Sentry alternative for a team that wants one platform instead of several tools?+
Datadog, since it bundles infrastructure monitoring, APM, and log management with over 1,000 integrations, covering more ground than Sentry does on its own.
Is there a cheaper alternative to Sentry for teams worried about usage-based billing?+
Axiom's Cloud plan starts at $25/month with no per-seat charge and includes 1,000 GB/month of data loading, and its compression keeps long-term storage cheap, though it doesn't have Sentry's release-tied error tracking. Axiom's separate always-free Personal tier gives 500 GB/month on its own, but caps out at one user and 25 GB of storage.
Which Sentry alternative is best for debugging high-cardinality traces?+
Honeycomb, built around BubbleUp, which automatically finds which dimensions differ inside an anomaly instead of making you guess from a stack trace.
Can I get Sentry-like error tracking without a usage-based bill?+
Yes, by self-hosting Sentry itself. It ships a free self-hosted, open-source edition that keeps the same release-tied error tracking without a usage meter. Grafana is a different route: you can also self-host its open-source LGTM stack for free, but it's a dashboarding and query layer over infrastructure like Prometheus, Loki, or Tempo, not a dedicated exception tracker the way Sentry is.
Sentry alternatives: pricing compared
Entry price, billing model, and whether pricing is public. 6 of 6 publish pricing you can check without talking to sales.
| Tool | Starting price | Billing | Free option | Pricing disclosed |
|---|---|---|---|---|
| Sentry | $26/mo | usage-based | Yes | Partly public |
| Datadog | $15/host/mo | usage-based | Yes | Partly public |
| New Relic | $10/seat/mo | tiered | Yes | Partly public |
| Honeycomb | $150/mo | usage-based | Yes | Partly public |
| Axiom | $25/mo | usage-based | Yes | Partly public |
| Grafana | $19/mo | usage-based | Yes | Partly public |
How we made these picks. We compare tools on public pricing, features, and hands-on assessment, then verify every price against the vendor's own page. We never accept payment for rankings. Read the full methodology. Spotted an error? Report it.